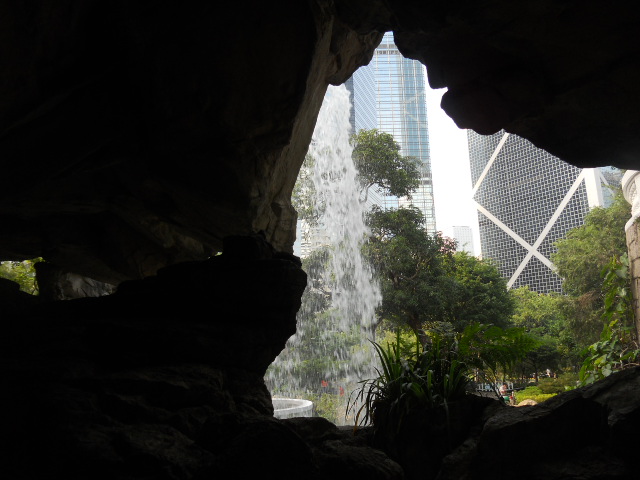
Can technology make tourism more transformative ?

Photo by Suzanne D. Williams on Unsplash

Transformative tourism (TT) is a type of meaningful and purposeful tourism. Traditional tourism is often used as an escape mechanism from everyday life (5). Transformative tourism is motivated by seeking (10). In transformational tourism the tourist seeks personal growth during their travels, which can take place in areas such as well-being, spirituality and education. The transformative experiences tourists have can be physical, emotional, attitudinal changes as well as the acquisition of context-specific skills (17). These types of tourists are motivated to return home with some personal tools enriched by the experiences of their journey (16) – the purpose of travel instead of escaping reality is about possibly making the reality somehow better or more meaningful. 

Transformative tourism is about change (hopefully) for the better and it can provide meaningful experiences. Because of this, it has gained a lot of attention during recent years; it has the power to change human behaviour and have a positive impact on the world (17). These explanations should be enough to support the idea that this type of tourism should be encouraged and developed further.

What makes designing and developing transformative tourism tricky is that it can be different for every tourist. By enhancing the experiences by deepening them, and making them more immersive, can support the occurrence of unintentional transformative tourism and elements of it. There are three different kinds of experiences that are considered transformative: epistemically transformative experience (having a first time experience), personally transformative experience (changes your point of view, your core preferences or you learn something that expands your mind) and epistemically and personally transformative experience, which is a holistic experience that possibly changes the course of one’s life (15). 

Technology has changed the value creation process in customer service as it has become a key contributor to consumer experience; a big part of the hospitality and tourism products and services are nowadays delivered by different technologies (8). Technologically enhanced tourism is also changing travel behaviour and activities (7). As technology is said to enhance the customer experience (1), could it also be used to develop and enrich tourism to be and to have more transformative elements?  What kinds of solutions are already out there that could be used to make tourism services and experiences possibly more transformative? 

There are two critical digital technology stimuli that can lead to a rich customer experience: personalisation and interactivity (14). Based on my readings, I would also add immersion to the list of stimuli. Immersion is the level that describes a feeling of ‘being there’ (20). These can be considered to be the key factors in any tourist experience maximization and thus important factors to consider when talking about whether technology can make tourism more transformative. 

Photo by Roméo A. on Unsplash

Smart tourism’s transformative possibilities 

Let’s look into the question through the concept of Smart Tourism, which means technology enhanced tourism. A Smart Travel Destination uses technology based tools in its products, services, spaces and experiences (7). These tools are Smart Tourism Technologies that refer to both general and specific applications that can enhance tourists’ experiences as well as generate added value (25). These applications can be anything from ubiquitous connectivity through Wi-Fi to sensors, smartphones and virtual reality (7; 8). Let’s have a look at how Smart Tourism Technologies (STTs) with the most transformative potential have to offer transformative tourism.

Gamification 

Gamification is the use of game design elements and game thinking in a non-gaming context (6) so it is more of a point of view when using smart technologies and designing transformative tourist experiences. With the help of gamification, tourists can get more engaged with the information and the experience they are receiving. If the tourist engagement rises, it can enhance the tourist experience in terms of flow, motivation, pleasure, immersion, enjoyment and presence (3). An example of using gamification and technology together to create a more transformative tourism experience could be an application that teaches the tourist history in the form of a game on a self-guided city tour. 

Augmented reality 

An augmented reality system merges physical and virtual objects in a natural environment, aligns them, and runs them interactively in real time (22). The goal of augmented reality is to support user interaction with the world around them (2). Augmented reality systems can be wearable computers, such as a smartwatch or smart glasses (26). How smart watches can enhance the tourist experience and possibly make it more transformative is that they extend the tourist’s sensory, cognitive, and motor limitations (2) and adapt the tourists behaviour to the changing environments. A wearable device can shape how tourists orient themselves, interact, and control their interactions with tourism attractions (21). Wearable computers, like any other computer, can also model behaviour and predict the future actions of the tourist so they are said to have potential to transform touristic experiences (21). 

Photo by My name is Yanick on Unsplash

Augmented reality has already been applied to destinations and to tourist experiences to assist tourists with retrieval and processing of information on points of interest at physical structures, national parks, walking experiences, historic and cultural objects, museum exhibits, art galleries, and indoor theme parks by overlaying exhibits with additional information through touch-screen displays, smartphones, and/or wearable devices (21).  With the help of technology assisted immersion, in this case augmented reality, tourists can be engaged in a more unique and interactive way than in traditional tourism (12). Also, if information is presented through augmented reality (or virtual reality), the information can become more memorable (11) and thus possibly more transformative.

As an augmented reality system merges physical and virtual objects in a natural environment to support tourists’ interaction with the world around them there are clear indicators of experience enhancement, which could make the experience more transformative. If we think about the gamification application example (the history teaching, game-like self-guided city tour application), it could also have augmented reality elements to it. These elements could be for example Google glasses type of images and videos of the historical events. Maybe they could even be holograms in the future. Whether or not the information provided to the tourist is transformative by itself, its transformative qualities could be enhanced and supported with augmented reality. 

Virtual reality 

When it comes to virtual reality there are more indicators of possible experience enhancement which could make the experience more transformative than augmented reality; the whole tourist experience can be designed from start to finish to be as transformative as possible. According to NASA virtual reality is “the use of computer technology to create the effect of an interactive three-dimensional world in which the objects have a sense of spatial presence.” In tourism it is used to capture destinations, attractions, to re-create events or to create totally new destinations, events and experiences (24). Virtual reality experiences have three key elements: visualisation components, immersion into the experience is a key factor and interactivity is involved in the experience (4). In the future these can most likely be personalised which means that there will be technically everything (personalisation, interactive and immersion) needed for a tourist to have an experience – whether or not that experience can be transformative depends on the tourist. 

Other Smart Tourism Technology possibilities

If we look at Smart tourism from a less futuristic and a more practical lens, STT is already capable of making experiences and customer touchpoints more interactive and personalised according to tourists’ preferences (13,11). With the help of STTs almost everything can be personalized and tourists can be provided with the most relevant and context-specific information, expertise, and experiences delivered in real-time or just when they need it (14). To have more personalized services and experiences can support transformative experiences happening, because each tourists’ experience and transformativity is highly objective. 

Tourism products can also be tailored to be more interactive with the help of STT (11). Interactivity gives buyers a sense of control so they can feel like they are in control of their own experience (27) – this can support the possible transformativity. At the same time, tourists can also interact with local residents within destination business ecosystems and the larger tourism ecosystems (7). This can support transformation as socialising with people from different cultures or just people outside your own circle of people can teach you something or show you a new point of view. Also, the use of STTs might affect the engagement and immersion of tourist experience (11). 

Smarter the more transformative?

Even though smart technologies are slowly getting more popular to use in tourist experiences and at smart tourism destinations, research on smart tourism destinations is limited. Research about gamification in tourism is also limited and the application of gamification in tourism is still in its infancy (8). There’s also no clear definition of what a consumer technology experience is or what a technology experience is. Because of the lack of research, the impacts of consumers’ technology experience on their overall experience  remain unknown (11). Needless to say, this means that there are also no studies about whether technology can make tourism more transformative so we have no way to answer whether or not technology can actually make tourism more transformative.

Regardless of the lack of research,  the introduction of guest-facing technologies is changing one of the industry’s key characteristics, human-to-human interactions, into guest-technology interactions. Tourists are already interacting with artificial intelligence chatbots, service delivery robots (11), and mobile tour guide apps have partly replaced the traditional human travel guide and information desk. Travellers are also creating their own travel itineraries with the help of the internet. Social contacts and socialising with new cultures is a big part of travel; a cross-cultural interaction can already be a transformative experience. Is there a possibility that technology could be making tourism less transformative? Technology is also making travelling a lot more convenient and easy. Yet somehow it seems that the reward of seeing the sunrise is much more transformative if you have climbed a mountain to witness it.

Also, a big part of the tourist experience is about immersion. Technology can of course help with immersion, but it can also hinder it. The term selective unplugging refers to being partially connected or disconnected from technology during travel to be more connected and present in the moment (19). To be more connected and present is essential for transformative travel, but what if connection and the feeling of being present are provided with the help of technology? Maybe then the tourist has chosen the wrong destination to travel to, but it’s an important topic to think about when designing and promoting technology-mediated travel experiences. Also when thinking about transformative travel, the tourists who decide to unplug are most likely tourists that are escaping their reality. They are not seeking something, which means that most of them are not transformative tourists. Still, the possible avoidance of technology makes it challenging to create transformative elements to tourist destinations and experiences with smart tourism, if people are not motivated to use technology during their trip.

Even though technology is changing the way we travel, its power and possibilities are yet to be harnessed when it comes to transformative tourism. Smart tourism in tourist experiences and in tourism in general is often in a supporting role; most smart technologies tourists use are STTs like maps/navigation apps, ride-sharing programs, city guide apps, mobile payment, and parking apps (14). Yet we can see that technology, especially augmented reality and virtual reality, has great potential to make tourism experiences more transformative in the future. Still, what is transformative to the tourist will always depend on the tourist itself – meeting a local in a travel  destination can be a far more transformative experience to the tourist than an augmented reality city tour. The city tour can just be a memorable and unforgettable experience at a smart tourism destination, which doesn’t sound like a bad thing at all.


REFERENCES

  1. Accenture (2019). Accenture-China-Digital-Transformation-Index-2019. Accenture.
  2. Barfield W. & Caudell T. (2001). Basic Concepts in Wearable Computers and Augmented Reality. In Fundamentals of Wearable Computers and Augmented Reality.
  3. Brown, E. & Cairns, P. (2004). A grounded investigation of game immersion. Conference on Human Factors in Computing Systems – Proceedings. 
  4. Cruz-Neira, C., Sandin, D. J., Defanti, T. A., Kenyon, R. V. & Hart, J. C. (1994). The cave: audio visual experience automatic virtual environment. Communications of the AMC.
  5. Cohen, E. (1996). A phenomenology of tourist experiences. The sociology of tourism: Theoretical and empirical investigations.
  6. Deterding, S., Dixon, D., Khaled, R., & Nacke, L. E. (2011). From game design elements to gamefulness: Defining “Gamification”. Mindtrek 2011 Proceedings. Tampere, Finland: ACM Press. 
  7. Gretzel, U., Sigala, M. & Xiang, Z. (2015). Smart tourism: foundations and developments. Electron Markets, 25.
  8. Huang C.D., Jahyun, D., Kichan, N.  & Woo, Y.C. (2017). Smart Tourism Technologies in Travel Planning: The Role of Exploration and Exploitation. Information & Management 54, 6.
  9. Huotari, K., & Hamari, J., 2012. Defining gamification: A service marketing perspective. In: Proceedings of the 16th International Academic MindTrek Conference, Tampere, Finland: ACM.
  10. Iso-Ahola, S. E. (1997). A psychological analysis of leisure and health. Work, leisure and well-being. New York, NY: Routledge.
  11. Jeong, M., & Shin, H. H. (2020). Tourists’ Experiences with Smart Tourism Technology at Smart Destinations and Their Behaviour Intentions. Journal of Travel Research, 59, 8.
  12. Lee, H., Lee, J., Chung, N. & Koo, C. (2018). Tourists’ happiness: Are there smart tourism technology effects? Asia Pacific J. Tour. 23.
  13. Oh, H., Fiore, A. M., & Jeoung, M. (2007). Measuring Experience Economy Concepts: Tourism Applications. Journal of Travel Research, 46, 2.
  14. Parise, S., Guinan, P.J. & Kafka, R. (2016). Solving the crisis of immediacy: How digital technology can transform the customer experience. Business Horizons, 59, 4.
  15. Paul, L.A. (2021). Teaching Guide for Transformative Experience. Yale University Department of Philosophy.
  16. Robledo, M.A. & Batle, J. (2015): Transformational tourism as a hero’s journey, Current Issues in Tourism.
  17. Rus, K.A., Dezsi, S, Ciascai, O.R. & Pop, F. (2022). Calibrating Evolution of Transformative Tourism: A Bibliometric Analysis. Sustainability 2022, 14.
  18. Shin, H.H., Jeong, M., So, K.K. & DiPietro, K. (2022). Consumers’ experience with hospitality and tourism technologies: Measurement development and validation. International Journal of Hospitality Management, 106.
  19. Tanti, A. & Buhalis, D. (2016). Connectivity and the Consequences of Being (Dis)connected. In: Inversini, A., Schegg, R. (eds) Information and Communication Technologies in Tourism 2016. Springer, Cham.
  20. Torabi Z., Shalbafian, A.A., Allam, Z., Ghaderi Z., Murgante. B, & Khavarian-Garmsir, A.R. (2022). Enhancing Memorable Experiences, Tourist Satisfaction, and Revisit Intention through Smart Tourism Technologies. Sustainability 2022, 14.
  21. Tussyadiah, I. P., Jung, T. H., & tom Dieck, M. C. (2018). Embodiment of Wearable Augmented Reality Technology in Tourism Experiences. Journal of Travel Research, 57, 5.
  22. van Krevelen, Rick & Poelman, Ronald. (2010). A Survey of Augmented Reality Technologies, Applications and Limitations. International Journal of Virtual Reality.
  23. Virtual Reality: Definition and Requirements. NASA. Retrieved 18.11.2022 from https://www.nas.nasa.gov/Software/VWT/vr.html
  24. Williams, P. & Hobson, J.P. (1995). Virtual reality and tourism: fact or fantasy?,Tourism Management, 16.
  25. Neuhofer, B., Buhalis, D., & Ladkin, A. (2015). Technology as a Catalyst of Change: Enablers and Barriers of the Tourist Experience and Their Consequences. Information and Communication Technologies in Tourism 2015.
  26. Rauschnabel, P. A., Brem, A., & Ivens, B. S. (2015). Who will buy smart glasses? Empirical results of two pre-market-entry studies on the role of personality in individual awareness. intended adoption of Google Glass wearables. Computers in Human Behavior, 49.
  27. Klein, L. R. (2003). Creating virtual product experiences: The role of telepresence. Journal of Interactive Marketing, 17, 1.

Research: Communicating the Image of North Karelia to German Market

Introduction of the study

The aim of this master’s thesis was to increase the knowledge of German tourists as a marketing segment and to clarify, what kind of image they have about North Karelia as a region. The thesis was made in collaboration with the North Karelian DMO VisitKarelia. An online survey was sent to two German Facebook-groups – Finnland Rundreisen and Finntouch – Finnland hautnah – both of them having so-called Finland enthusiasts as their followers. The survey was written in German and included 26 questions. In total 209 responses were gathered in February 2022 just before the Ukraine War started. So, the situation did not have impact on the results.

visitkarelia-hiking-forest-lake-northkarelia-pohjoiskarjala-harritarvainen

A profile of a potential German tourist

Firstly, the most potential target group, which would travel to North Karelia was discovered. A profile of a German tourist was following: a female, who is 40-59 years old. She is in relationship and has kid(s). She is currently employed, and income level is below the average (3975 € per month in Ger-many in 2020). Most likely she is from Southern or Western part of the Germany. She will arrive to Finland by plain or ship and continue trip by car or plane to North Karelia. She is traveling with a partner or family and make all the bookings by herself. In general, the willingness to travel to North Karelia within the next two years was high and most of the respondents have visited Finland several times before.

Most actively used information channels

Secondly, it was discovered which online and traditional information channels are most actively used by German tourists when they are looking for information about a destination. On the top were official web page of a destination, Booking.com and Instagram account of a destination. Also, Facebook page of a destination, travel related Facebook groups and TripAdvisor were rather high on the list. The most actively used traditional information channels were own experience, WOM from friends and relatives, guidebooks and maps. The following channels were brochures, TV, magazines, and journals. On the contrary to earlier studies, travel agencies were not actively used by this response group. Also, TikTok kept the last place.

Especially nature, lakes and forests interest German tourists in North Karelia

Thirdly, respondents were asked to describe North Karelia with three words. The results showed that North Karelia is strongly connected to nature, lakes, forests and natural phenomena. In addition, especially Karelian pies and Karelian culture were well known among the respondents. They also had a list with North Karelian attributes. Also there, nature and culture related attributes were rated high-est. Special accommodation, meditation and luxurious experiences were not important for Germans. When North Karelia visitors and non-visitors were compared, especially Finnish sauna and rural set-tings were more important for those, who have experienced them by themselves. Surprisingly, Russia was mentioned several times in contexts of border, history and location. However, the results did not reveal if it has an impact on traveling willingness.

koli-northkarelia-pohjoiskarjala-harritarvainen

What to highlight in marketing communication?

Lastly, the most important marketing communication statements were discovered. Especially, the possibility to book accommodation, activities and services online were rated on the top. Germans also appreciated, that there is information available how to reach the destination, information about distances and a map of the location. Also, sustainability was an important factor for Germans. Specially, men and respondents with higher income level found sustainability very important. Having information in German was a neutral factor. Only the age group of 60-64 rated it as an important.


Pictures: Harri Tarvainen / VisitKarelia

A Study About LGBTQ Community’s Perception of Finland as a Tourist Destination


In recent decades, LGBTQ tourism has been on the rise largely due to progress in human rights. The LGBTQ market is considered recession-proof and one of the fastest-growing markets in the world. These reasons alone could demonstrate the importance of attracting tourists from this community to Finland. Finland is already in a good position regarding human and LGBTQ rights; therefore, it seems natural to tap into the LGBTQ market.

This quantitative research aimed to increase the general understanding of LGBTQ tourism in Finland through discovering the international LGBTQ community’s perception of Finland and realizing which of Finland’s pull factors can entice them more. In addition, this study aimed to discover ways Finland can communicate its friendliness to the LGBTQ community.

The findings of this study show that the international LGBTQ community perceives Finland positively as a tourist destination. One of the reasons for this perception could be the widespread content that can be found on social media and online news outlets about Finland. Finland has been named the happiest country in the world for five years in a row and Tom of Finland is a well-renowned comic among the LGBTQ community. These factors could have created an unconscious and unintended awareness of Finland.

Being identified as gay-friendly by the family and friends of the LGBTQ community members and being recommended by them are the most important ways to communicate the gay-friendliness of Finland. The only way to transfer the gay-friendliness values through family members is by being authentic. However, first there is a need to understand what items are important for the LGBTQ community in terms of gay-friendliness.

These items are: same-sex marriage, how anti-LGBTQ a destination is, incorporating LGBTQ themes/imagery in mainstream media/advertising, existence of gay culture in the destination, socializing with LGBTQ people, feeling welcome in the destination, an open and tolerant attitude of the locals, and being identified by a third party and friends as gay-friendly.

Finland as a gay-friendly country fulfils the gay-friendliness requirements of the LGBTQ community. However, this gay-friendliness can be elevated through incorporating two items. First, by using LGBTQ themes/imagery in any kind of advertisements, whether they be photo- or video-based. Secondly, by creating authenticity in tourism businesses, which can be achieved through ongoing training of staff in tourism businesses, the obtaining of certificates from LGBTQ organizations and workshops, such as ‘We Speak Gay’ and ILGTA, and developing a relationship with local LGBTQ organizations and LGBTQ charities.

Another research question that was explored in this study was which attributes of Finland can act as pull factors for the international LGBTQ community. In answering this question, eight attractions were identified. These are: Northern lights, relaxing atmosphere, exploring new places, quality eating experiences, opportunities to see wildlife and nature, dramatic/beautiful landscapes and scenery, a safe and secure destination related to personal safety, and the LGBTQ friendliness of Finland. Interestingly, no Lakeland activities were important for respondents; in fact they had the lowest score.

Nature and new experiences were the frontrunners Finland’s pull factors; therefore, DMOs, with the participation of the local authority could plan a cohesive design to support infrastructure and draw a specific budget for the maintenance and marketing of these areas. Since a quality eating experience was one of the essential attributes of Finland for the LGBTQ community, working with non-Finnish influencers on Instagram, TikTok, and YouTube could be beneficial for exposing more people to Finnish food. In addition, local DMOs could invite cooks and chefs from the local area or go to their place of business and film how they cook their traditional Finnish food and then post these videos on their own social media channels.

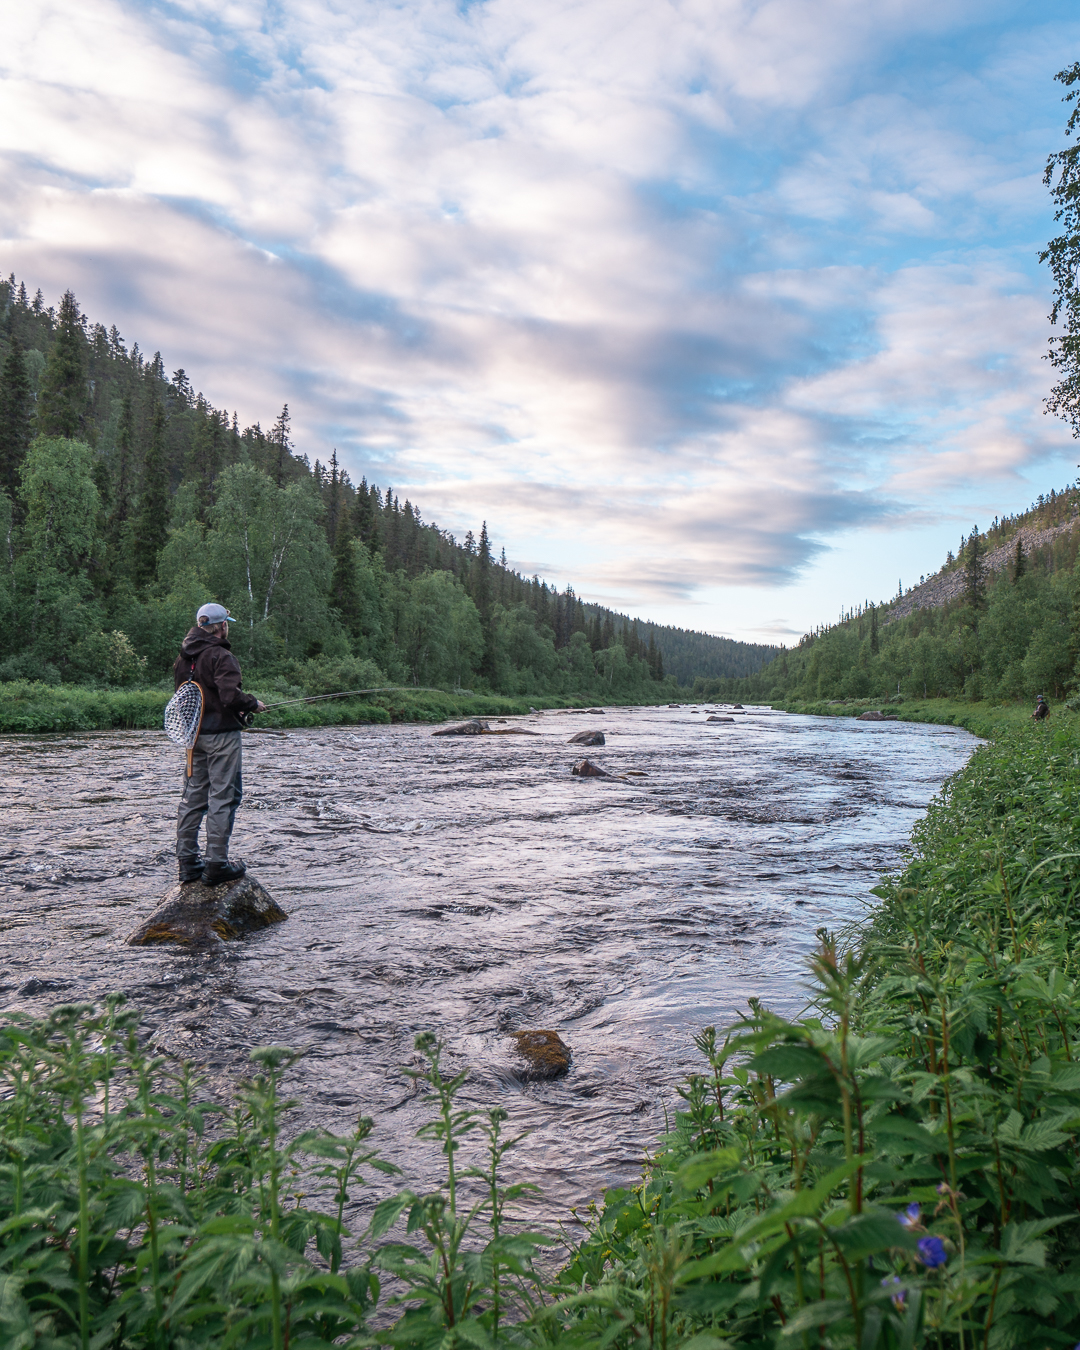
Research: What Do Fishermen Value as a Tourist Experience?


fishing tourist experience
© Anssi Ylipulli / KeloVentures

A new Tourism Marketing and Management research suggests that fishing tourists’ lived experience is always built around the same core elements. The elements in the order of importance are the following: emotional value, social value, and epistemic value. This means that Finnish fishing tourists value such elements as nature, peace-and-silence (i.e. emotional value). Also, sharing the own fishing success, fishing know-how and growing the social esteem (i.e. social value) is important. As well as, new experiences and self-development (i.e. epistemic value).

Based on their seriousness towards fishing tourism, three groups are identified: Hobbyists, Active tourist anglers, and Occasional tourist anglers. Even though the relative importance of value components was the same in every seriousness group, more serious fishermen had higher values.

fishing tourist experience
© Anssi Ylipulli / KeloVentures

Practically this means that serious fishermen’s, (i.e. hobbyists) total experience (incl. fishing activity, travelling, accommodation, etc.) is more strongly built around the fishing activity. Thus, they are more likely focusing on self-development, learning of new skills, visiting new fishing spots, and actively sharing this knowledge with like-minded people. Whereas, the fishing activity itself does not seem to have the same meaning for less serious fishermen (i.e. active tourist anglers and occasional tourist anglers).


fishing tourist experience
© Anssi Ylipulli / KeloVentures

Six different types of recreational fishermen

The research also identified six different types of recreational fishermen based on the benefits they seek.

Fishing tourists’ profiles

‘Service-oriented novelty seekers’ is the most potential group from the guide services perspective. That’s because their experience is often carried out by using a different kind of guide-services. Segment’s fishing tourist experience is built around networking, novelty, and development.

© Anssi Ylipulli / KeloVentures

Practically, their fishing tourist experience is more likely a social event that takes place in a peaceful environment and focuses on networking with like-minded people. These fishing tourists are also willing to try new fishing spots, seek new experiences, and use professional fishing guide’s to develop their own fishing-related skills. Thus, it can be proposed that usage of different services enable them to realize their own dreams which would otherwise be difficult or even impossible to implement.

fishing tourist experience
© Anssi Ylipulli / KeloVentures

How to use the results in tourism business development?

Company or organisation may only gain a competitive advantage with benefit segmentation if they understand the preferences of different market segments.

fishing tourist experience
© Anssi Ylipulli / KeloVentures

The segmentation results should be combined with other segmentation variables to generate even more accurate customer profiles. Hence, future development should more likely focus on the main characteristics of seriousness clusters, preferences of individual segments, and combine these together with the company/organization own special characteristics. The idea is that this kind of profile combines the company/organization service offering, main characteristics of different seriousness clusters as well as the preferences of fishing tourist segments. Practically, customer profiles should be something like “Service-minded novelty seeker who likes to fish monster pikes” or “Development-oriented salmon rower” or “Group-focused trout fisherman who focus on an ice fishing”.

© Anssi Ylipulli / KeloVentures

About the research

The research approach was quantitative, and the data was collected from the Finnish recreational fishermen by questionnaire. In total, 1 166 respondents participated in the survey. However, the results only focus on the respondents (937) who had participated in a fishing tourism trip.

fishing tourist experience
© Anssi Ylipulli / KeloVentures

The empirical study is based on two basic theories, namely serious leisure and consumption value. According to the theory of serious leisure, the fishing tourists have been categorized into three clusters, based on their level of seriousness in fishing. The components of experience value are based on the theory of consumption value, completed with togetherness value which was found in earlier hunting tourism research. In addition, these value dimensions are utilized as criteria for benefit segmentation, when searching for different fishing tourist segments. The data was analysed by using cluster analysis, principal component analysis, and comparative analysis methods.

More information

Are you looking for an international tourism-focused master’s degree programme in business? Tourism Marketing and Management programme by University of Eastern Finland provides a unique learning experience for students who have finished their bachelor’s degree and are looking for new skills and knowledge in developing tourism industry in a sustainable way. Read more about the programme at www.uef.fi/tmm.

Overview of Quantitative Data Analysis Methods in SPSS

Analytical thinking in marketing is critical. If marketing is both art and science, the numbers play a big role in the science of marketing. In our Tourism Marketing and Management programme, we study analytical thinking in many courses. One of those is our Practical Tourism Research course. During the course, our students study big data, survey research, online data sets, experimental research and sensor technology as a source of quantitative data. Our main data analysis software is SPSS.

To help our students learn data analysis methods in SPSS, I have collected (From SPSS manual) functionalities and use examples for most common data analysis methods in SPSS. This provides a one-page overview of different data analysis methods and helps to find the correct one for different use cases. Hopefully, the reads of this blog will find this helpful!

SPSS Analyze path

Functionality

Example

Descriptive Statistics

Analyze -> Descriptive statistics -> Frequencies Provides statistics and graphical displays that are useful for describing many types of variables, how many of what are there in your data. The Frequencies procedure is a good place to start looking at your data. What is the distribution of a company’s customers by industry type? From the output, you might learn that 37.5% of your customers are in government agencies, 24.9% are in corporations, 28.1% are in academic institutions, and 9.4% are in the healthcare industry. For continuous, quantitative data, such as sales revenue, you might learn that the average product sale is $3,576, with a standard deviation of $1,078.
Analyze -> Descriptive statistics -> Descriptives Displays univariate summary statistics for several variables in a single table and calculates standardized values (z scores). Variables can be ordered by the size of their means (in ascending or descending order), alphabetically, or by the order in which you select the variables (the default). If each case in your data contains the daily sales totals for each member of the sales staff (for example, one entry for Bob, one entry for Kim, and one entry for Brian) collected each day for several months, the Descriptives procedure can compute the average daily sales for each staff member and can order the results from highest average sales to lowest average sales.
Analyze -> Descriptive statistics -> Explore The Explore procedure produces summary statistics and graphical displays, either for all of your cases or separately for groups of cases. There are many reasons for using the Explore procedure–data screening, outlier identification, description, assumption checking, and characterizing differences among subpopulations (groups of cases). The exploration may indicate that you need to transform the data if the technique requires a normal distribution. Or you may decide that you need nonparametric tests. Look at the distribution of maze-learning times for rats under four different reinforcement schedules. For each of the four groups, you can see if the distribution of times is approximately normal and whether the four variances are equal. You can also identify the cases with the five largest and five smallest times. The boxplots and stem-and-leaf plots graphically summarize the distribution of learning times for each of the groups.
Analyze -> Descriptive statistics -> Crosstabs The Crosstabs procedure forms two-way and multiway tables and provides a variety of tests and measures of association for two-way tables. The structure of the table and whether categories are ordered determine what test or measure to use. Are customers from small companies more likely to be profitable in sales of services (for example, training and consulting) than those from larger companies? From a crosstabulation, you might learn that the majority of small companies (fewer than 500 employees) yield high service profits, while the majority of large companies (more than 2,500 employees) yield low service profits.

Compare Means

Analyze- > Compare means -> Means The Means procedure calculates subgroup means and related univariate statistics for dependent variables within categories of one or more independent variables. Optionally, you can obtain a one-way analysis of variance, eta, and tests for linearity. Measure the average amount of fat absorbed by three different types of cooking oil, and perform a one-way analysis of variance to see whether the means differ.
Analyze- > Compare means -> One-Sample T Test The One-Sample T Test procedure tests whether the mean of a single variable differs from a specified constant. A researcher might want to test whether the average IQ score for a group of students differs from 100. Or a cereal manufacturer can take a sample of boxes from the production line and check whether the mean weight of the samples differs from 1.3 pounds at the 95% confidence level.
Analyze- > Compare means -> Independent Samples T Test The Independent-Samples T Test procedure compares means for two groups of cases. Ideally, for this test, the subjects should be randomly assigned to two groups, so that any difference in response is due to the treatment (or lack of treatment) and not to other factors. This is not the case if you compare average income for males and females. A person is not randomly assigned to be a male or female. In such situations, you should ensure that differences in other factors are not masking or enhancing a significant difference in means. Differences in average income may be influenced by factors such as education (and not by sex alone). Patients with high blood pressure are randomly assigned to a placebo group and a treatment group. The placebo subjects receive an inactive pill, and the treatment subjects receive a new drug that is expected to lower blood pressure. After the subjects are treated for two months, the two-sample t test is used to compare the average blood pressures for the placebo group and the treatment group. Each patient is measured once and belongs to one group.
Analyze- > Compare means -> Paired Samples T Test The Paired-Samples T Test procedure compares the means of two variables for a single group. The procedure computes the differences between values of the two variables for each case and tests whether the average differs from 0. In a study on high blood pressure, all patients are measured at the beginning of the study, given a treatment, and measured again. Thus, each subject has two measures, often called before and after measures. An alternative design for which this test is used is a matched-pairs or case-control study, in which each record in the data file contains the response for the patient and also for his or her matched control subject. In a blood pressure study, patients and controls might be matched by age (a 75-year-old patient with a 75-year-old control group member).
Analyze- > Compare means -> One-Way ANOVA The One-Way ANOVA procedure produces a one-way analysis of variance for a quantitative dependent variable by a single factor (independent) variable. Analysis of variance is used to test the hypothesis that several means are equal. This technique is an extension of the two-sample t test.

In addition to determining that differences exist among the means, you may want to know which means differ. There are two types of tests for comparing means: a priori contrasts and post hoc tests. Contrasts are tests set up before running the experiment, and post hoc tests are run after the experiment has been conducted. You can also test for trends across categories.

Doughnuts absorb fat in various amounts when they are cooked. An experiment is set up involving three types of fat: peanut oil, corn oil, and lard. Peanut oil and corn oil are unsaturated fats, and lard is a saturated fat. Along with determining whether the amount of fat absorbed depends on the type of fat used, you could set up an a priori contrast to determine whether the amount of fat absorption differs for saturated and unsaturated fats.

Compare Means

Analyze- > Compare Means-> Bivariate Correlations The Bivariate Correlations procedure computes Pearson’s correlation coefficient, Spearman’s rho, and Kendall’s tau-b with their significance levels. Correlations measure how variables or rank orders are related. Before calculating a correlation coefficient, screen your data for outliers (which can cause misleading results) and evidence of a linear relationship. Pearson’s correlation coefficient is a measure of linear association. Two variables can be perfectly related, but if the relationship is not linear, Pearson’s correlation coefficient is not an appropriate statistic for measuring their association. Is the number of games won by a basketball team correlated with the average number of points scored per game? A scatterplot indicates that there is a linear relationship. Analyzing data from the 1994–1995 NBA season yields that Pearson’s correlation coefficient (0.581) is significant at the 0.01 level. You might suspect that the more games won per season, the fewer points the opponents scored. These variables are negatively correlated (–0.401), and the correlation is significant at the 0.05 level.
Analyze- > Compare Means -> Partial The Partial Correlations procedure computes partial correlation coefficients that describe the linear relationship between two variables while controlling for the effects of one or more additional variables. Correlations are measures of linear association. Two variables can be perfectly related, but if the relationship is not linear, a correlation coefficient is not an appropriate statistic for measuring their association. Is there a relationship between healthcare funding and disease rates? Although you might expect any such relationship to be a negative one, a study reports a significant positive correlation: as healthcare funding increases, disease rates appear to increase. Controlling for the rate of visits to healthcare providers, however, virtually eliminates the observed positive correlation. Healthcare funding and disease rates only appear to be positively related because more people have access to healthcare when funding increases, which leads to more reported diseases by doctors and hospitals.
Analyze- > Compare Means -> Distances This procedure calculates any of a wide variety of statistics measuring either similarities or dissimilarities (distances), either between pairs of variables or between pairs of cases. These similarity or distance measures can then be used with other procedures, such as factor analysis, cluster analysis, or multidimensional scaling, to help analyze complex datasets. Is it possible to measure similarities between pairs of automobiles based on certain characteristics, such as engine size, MPG, and horsepower? By computing similarities between autos, you can gain a sense of which autos are similar to each other and which are different from each other. For a more formal analysis, you might consider applying a hierarchical cluster analysis or multidimensional scaling to the similarities to explore the underlying structure.

Generalized Linear Models

Analyze- > Generalized Linear Models -> Generalized Linear Models The generalized linear model expands the general linear model so that the dependent variable is linearly related to the factors and covariates via a specified link function. Moreover, the model allows for the dependent variable to have a non-normal distribution. It covers widely used statistical models, such as linear regression for normally distributed responses, logistic models for binary data, loglinear models for count data, complementary log-log models for interval-censored survival data, plus many other statistical models through its very general model formulation. A shipping company can use generalized linear models to fit a Poisson regression to damage counts for several types of ships constructed in different time periods, and the resulting model can help determine which ship types are most prone to damage.


A car insurance company can use generalized linear models to fit a gamma regression to damage claims for cars, and the resulting model can help determine the factors that contribute the most to claim size.


Medical researchers can use generalized linear models to fit a complementary log-log regression to interval-censored survival data to predict the time to recurrence for a medical condition.


Regression

Analyze -> Regression -> Linear Linear Regression estimates the coefficients of the linear equation, involving one or more independent variables, that best predict the value of the dependent variable. For example, you can try to predict a salesperson’s total yearly sales (the dependent variable) from independent variables such as age, education, and years of experience. Is the number of games won by a basketball team in a season related to the average number of points the team scores per game? A scatterplot indicates that these variables are linearly related. The number of games won and the average number of points scored by the opponent are also linearly related. These variables have a negative relationship. As the number of games won increases, the average number of points scored by the opponent decreases. With linear regression, you can model the relationship of these variables. A good model can be used to predict how many games teams will win.
Analyze -> Regression -> Binary Logistics Logistic regression is useful for situations in which you want to be able to predict the presence or absence of a characteristic or outcome based on values of a set of predictor variables. It is similar to a linear regression model but is suited to models where the dependent variable is dichotomous. Logistic regression coefficients can be used to estimate odds ratios for each of the independent variables in the model. Logistic regression is applicable to a broader range of research situations than discriminant analysis. What lifestyle characteristics are risk factors for coronary heart disease (CHD)? Given a sample of patients measured on smoking status, diet, exercise, alcohol use, and CHD status, you could build a model using the four lifestyle variables to predict the presence or absence of CHD in a sample of patients. The model can then be used to derive estimates of the odds ratios for each factor to tell you, for example, how much more likely smokers are to develop CHD than nonsmokers.
Analyze -> Regression -> Multinomial Logistic Regression Multinomial Logistic Regression is useful for situations in which you want to be able to classify subjects based on values of a set of predictor variables. This type of regression is similar to logistic regression, but it is more general because the dependent variable is not restricted to two categories. In order to market films more effectively, movie studios want to predict what type of film a moviegoer is likely to see. By performing a Multinomial Logistic Regression, the studio can determine the strength of influence a person’s age, gender, and dating status has upon the type of film they prefer. The studio can then slant the advertising campaign of a particular movie toward a group of people likely to go see it.
Analyze -> Regression -> Ordinal Regression Ordinal Regression allows you to model the dependence of a polytomous ordinal response on a set of predictors, which can be factors or covariates. The design of Ordinal Regression is based on the methodology of McCullagh (1980, 1998), and the procedure is referred to as PLUM in the syntax. Ordinal Regression could be used to study patient reaction to drug dosage. The possible reactions may be classified as none, mild, moderate, or severe. The difference between a mild and moderate reaction is difficult or impossible to quantify and is based on perception. Moreover, the difference between a mild and moderate response may be greater or less than the difference between a moderate and severe response.
Analyze -> Regression -> Probit This procedure measures the relationship between the strength of a stimulus and the proportion of cases exhibiting a certain response to the stimulus. It is useful for situations where you have a dichotomous output that is thought to be influenced or caused by levels of some independent variable(s) and is particularly well suited to experimental data. This procedure will allow you to estimate the strength of a stimulus required to induce a certain proportion of responses, such as the median effective dose. How effective is a new pesticide at killing ants, and what is an appropriate concentration to use? You might perform an experiment in which you expose samples of ants to different concentrations of the pesticide and then record the number of ants killed and the number of ants exposed. Applying probit analysis to these data, you can determine the strength of the relationship between concentration and killing, and you can determine what the appropriate concentration of pesticide would be if you wanted to be sure to kill, say, 95% of exposed ants.

Classify

Analyze -> Classify -> K-Means Cluster Analysis This procedure attempts to identify relatively homogeneous groups of cases based on selected characteristics, using an algorithm that can handle large numbers of cases. However, the algorithm requires you to specify the number of clusters. You can specify initial cluster centers if you know this information. You can select one of two methods for classifying cases, either updating cluster centers iteratively or classifying only. You can save cluster membership, distance information, and final cluster centers. Optionally, you can specify a variable whose values are used to label casewise output. You can also request analysis of variance F statistics. While these statistics are opportunistic (the procedure tries to form groups that do differ), the relative size of the statistics provides information about each variable’s contribution to the separation of the groups. What are some identifiable groups of television shows that attract similar audiences within each group? With k-means cluster analysis, you could cluster television shows (cases) into k homogeneous groups based on viewer characteristics. This process can be used to identify segments for marketing. Or you can cluster cities (cases) into homogeneous groups so that comparable cities can be selected to test various marketing strategies.
Analyze -> Classify -> Hierarchical Cluster Analysis This procedure attempts to identify relatively homogeneous groups of cases (or variables) based on selected characteristics, using an algorithm that starts with each case (or variable) in a separate cluster and combines clusters until only one is left. You can analyze raw variables, or you can choose from a variety of standardizing transformations. Distance or similarity measures are generated by the Proximities procedure. Statistics are displayed at each stage to help you select the best solution. Are there identifiable groups of television shows that attract similar audiences within each group? With hierarchical cluster analysis, you could cluster television shows (cases) into homogeneous groups based on viewer characteristics. This can be used to identify segments for marketing. Or you can cluster cities (cases) into homogeneous groups so that comparable cities can be selected to test various marketing strategies.
Analyze -> Classify -> Discriminant Discriminant analysis builds a predictive model for group membership. The model is composed of a discriminant function (or, for more than two groups, a set of discriminant functions) based on linear combinations of the predictor variables that provide the best discrimination between the groups. The functions are generated from a sample of cases for which group membership is known; the functions can then be applied to new cases that have measurements for the predictor variables but have unknown group membership.

Note: The grouping variable can have more than two values. The codes for the grouping variable must be integers, however, and you need to specify their minimum and maximum values. Cases with values outside of these bounds are excluded from the analysis.


On average, people in temperate zone countries consume more calories per day than people in the tropics, and a greater proportion of the people in the temperate zones are city dwellers. A researcher wants to combine this information into a function to determine how well an individual can discriminate between the two groups of countries. The researcher thinks that population size and economic information may also be important. Discriminant analysis allows you to estimate coefficients of the linear discriminant function, which looks like the right side of a multiple linear regression equation. That is, using coefficients a, b, c, and d, the function is:

D = a * climate + b * urban + c * population + d * gross domestic product per capita


If these variables are useful for discriminating between the two climate zones, the values of D will differ for the temperate and tropic countries. If you use a stepwise variable selection method, you may find that you do not need to include all four variables in the function.


Dimension Reduction

Analyze -> Dimension Reduction -> Factor Analysis Factor analysis attempts to identify underlying variables, or factors, that explain the pattern of correlations within a set of observed variables. Factor analysis is often used in data reduction to identify a small number of factors that explain most of the variance that is observed in a much larger number of manifest variables. Factor analysis can also be used to generate hypotheses regarding causal mechanisms or to screen variables for subsequent analysis (for example, to identify collinearity prior to performing a linear regression analysis).

The factor analysis procedure offers a high degree of flexibility:

• Seven methods of factor extraction are available.

• Five methods of rotation are available, including direct oblimin and promax for nonorthogonal rotations.

• Three methods of computing factor scores are available, and scores can be saved as variables for further analysis.


What underlying attitudes lead people to respond to the questions on a political survey as they do? Examining the correlations among the survey items reveals that there is significant overlap among various subgroups of items–questions about taxes tend to correlate with each other, questions about military issues correlate with each other, and so on. With factor analysis, you can investigate the number of underlying factors and, in many cases, identify what the factors represent conceptually. Additionally, you can compute factor scores for each respondent, which can then be used in subsequent analyses. For example, you might build a logistic regression model to predict voting behavior based on factor scores.
Analyze -> Dimension Reduction -> Correspondence Analysis One of the goals of correspondence analysis is to describe the relationships between two nominal variables in a correspondence table in a low-dimensional space, while simultaneously describing the relationships between the categories for each variable. For each variable, the distances between category points in a plot reflect the relationships between the categories with similar categories plotted close to each other. Projecting points for one variable on the vector from the origin to a category point for the other variable describe the relationship between the variables.

An analysis of contingency tables often includes examining row and column profiles and testing for independence via the chi-square statistic. However, the number of profiles can be quite large, and the chi-square test does not reveal the dependence structure. The Crosstabs procedure offers several measures of association and tests of association but cannot graphically represent any relationships between the variables.

Factor analysis is a standard technique for describing relationships between variables in a low-dimensional space. However, factor analysis requires interval data, and the number of observations should be five times the number of variables. Correspondence analysis, on the other hand, assumes nominal variables and can describe the relationships between categories of each variable, as well as the relationship between the variables. In addition, correspondence analysis can be used to analyze any table of positive correspondence measures.


Correspondence analysis could be used to graphically display the relationship between staff category and smoking habits. You might find that with regard to smoking, junior managers differ from secretaries, but secretaries do not differ from senior managers. You might also find that heavy smoking is associated with junior managers, whereas light smoking is associated with secretaries.

Reliability Analysis

Analysis -> Scale -> Reliability Analysis Reliability analysis allows you to study the properties of measurement scales and the items that compose the scales. The Reliability Analysis procedure calculates a number of commonly used measures of scale reliability and also provides information about the relationships between individual items in the scale. Intraclass correlation coefficients can be used to compute inter-rater reliability estimates. Does my questionnaire measure customer satisfaction in a useful way? Using reliability analysis, you can determine the extent to which the items in your questionnaire are related to each other, you can get an overall index of the repeatability or internal consistency of the scale as a whole, and you can identify problem items that should be excluded from the scale.

Are you looking for an international tourism-focused master’s degree programme in business? Tourism Marketing and Management programme by University of Eastern Finland provides a unique learning experience for students who have finished their bachelor’s degree and are looking for new skills and knowledge in developing tourism industry in a sustainable way. Read more about the programme at www.uef.fi/tmm.

Complexity of academic research

To understand the world

I’ve started my university (academic research) studies this autumn. I´m 32 years old, and I like my age. At least for me, the somewhat life experience gives a better feeling in this rather complex overall feeling that I am having at the moment. I will get back to this later.

I’ve realized the complexity of dealing with academic research and creating my personal content into it, in this world of “no- black and white, “no- single wrong or right”- dilemmas of academic studies in general. This is not totally new founding for me – but now I am really in this in practice, because of my master degree studies in Tourism marketing and management programme.

Accepting, and using common sense

Recently I asked from my professor during one lectures discussion – How I can know whether it is fine or correct to use some “basic” theory as a background of some subject from what I’m trying to write about, or not?  She answered (looking at me first with the facial expression of “exactly- good question, but…” and then she gave me and the group the answer of her that there is no clear answer for this, you need to use your common sense in these cases for making your decisions and choices.

I´m little surprised that it feels so disturbing for me, (or whoever involved in the academic research), that it is, at least usually, very hard to find the one and only truth or theory for some subject or theme that we are studying. I happen to be quite flexible and highly spontaneous personality myself.  So it makes it even weirder. I come back to my age-thing. Because of it, and maybe other reasons too, I’m still very happy not to be stressing this issue too much. I’m fine with it, I understand that I’m not alone with it, – I’m just reflecting it.

Dreaming about getting that absolute truth out…

Though I’m very curious to know, whether I’m actually capable at some point during my studies to get use of the theory or truth which I can use as an “absolute” for some subjects research findings or as a suggestion of my own for some topic.

My teacher said that “the only constant thing in this world is change”, as a starting point for further discussion. I agree mostly with this statement, however, I cannot say it is an absolute truth to everything. It is somehow easy, comfortable and kind of highly secured for me to realize and feel, that example the most important theories for researchers to use, apply and form formulate something new (!) already exists.

Hong Kong, 2011 (Jenni Kaitila)

Or not

This gives me huge importance when dealing with the almost absolute complexity and no- single truth experiences while I’m studying the life of academic research. I remember also, that this same teacher stated the truth about also agreeing that in fact, the main theories and typologies in general already have been founded before. And the timeless value of sources which exists in those. He said this during the information technology- courses discussion session, and I absolutely liked the moment and the fascinating, yet somehow secured feeling of having the experience of learning same time about the new world and information technology – and somewhat it’s relying on still in the theories presented and founded already from decades ago.

Hong Kong (Macao), 2011 (Jenni Kaitila)