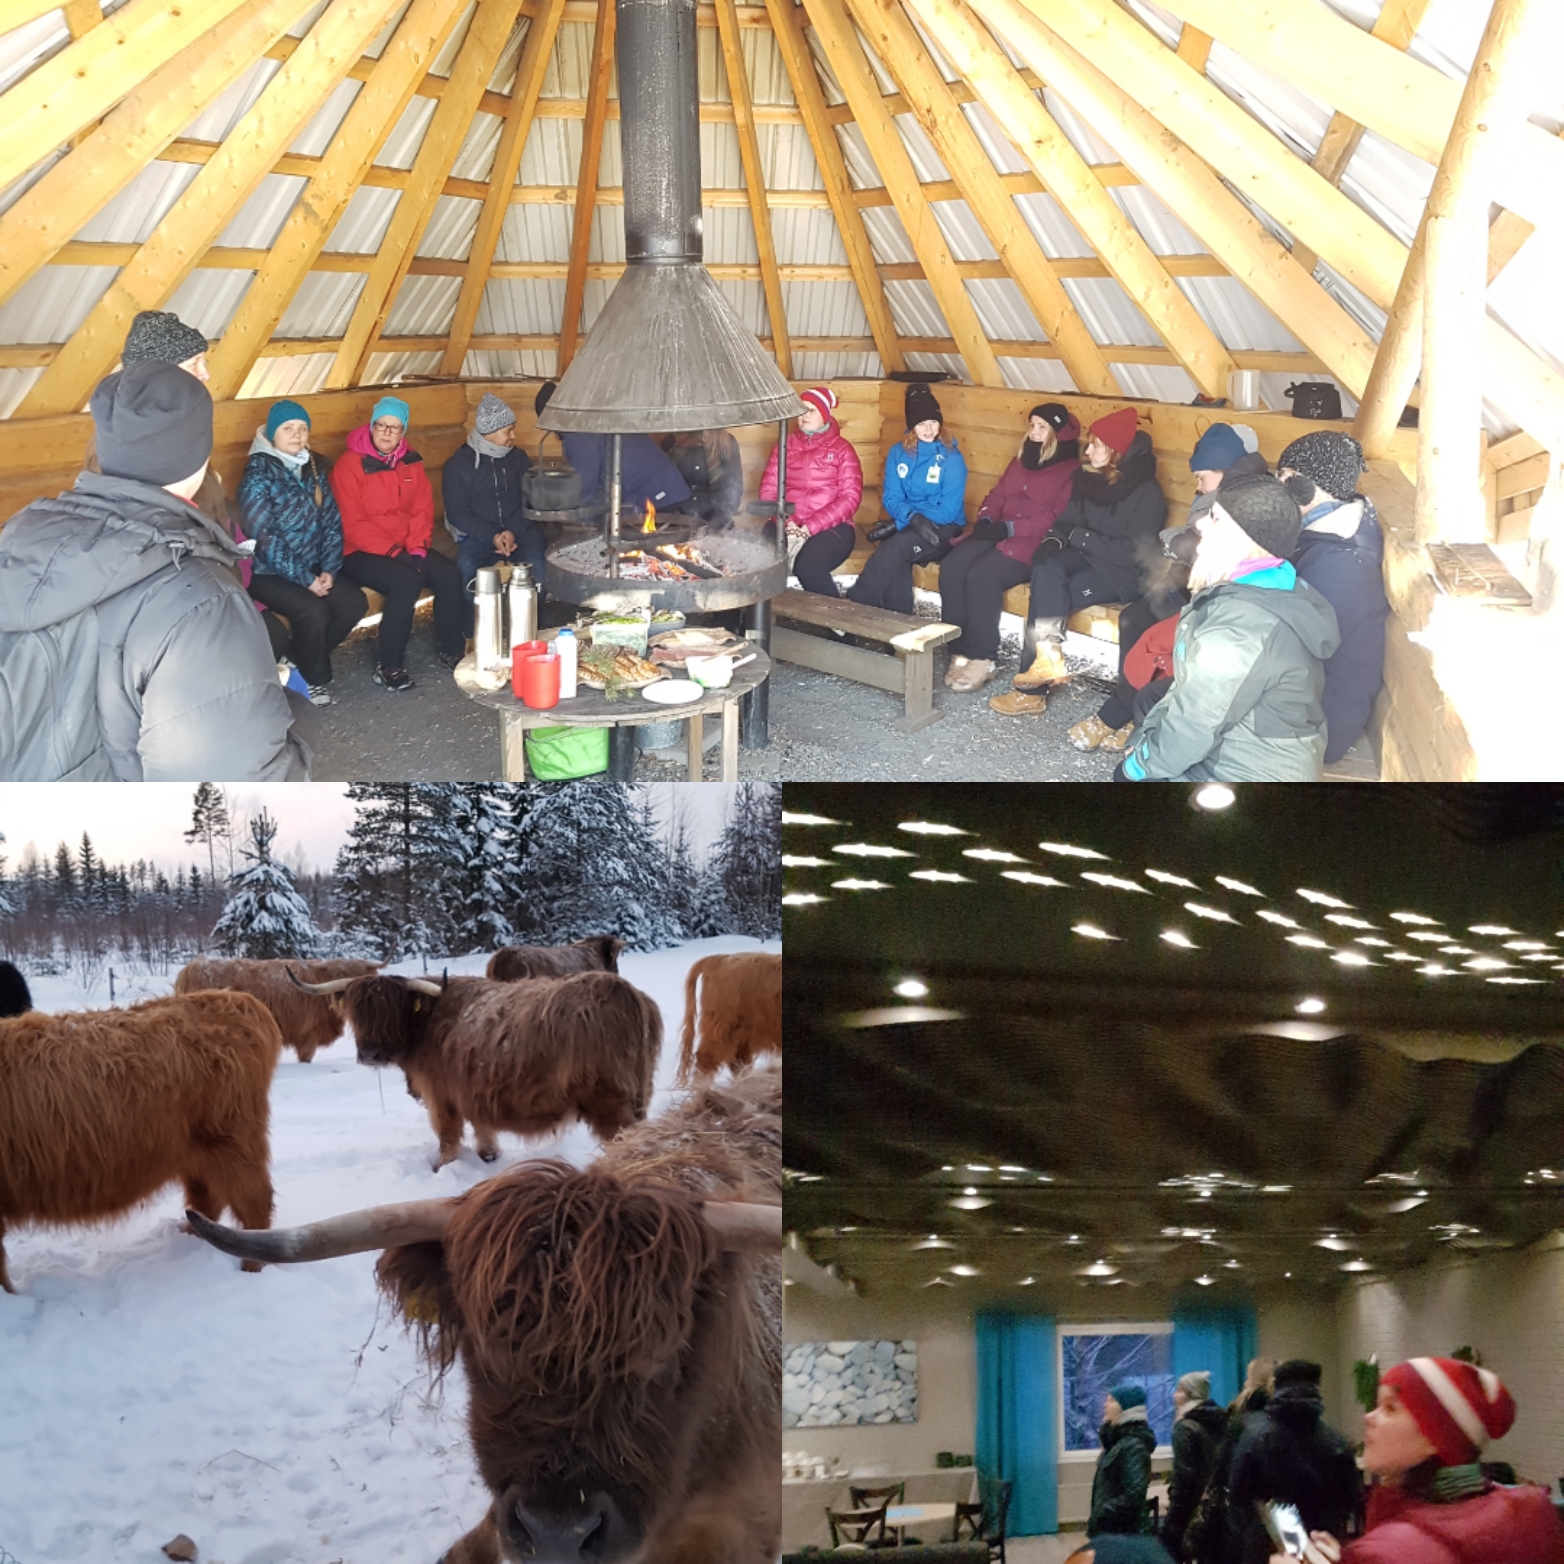
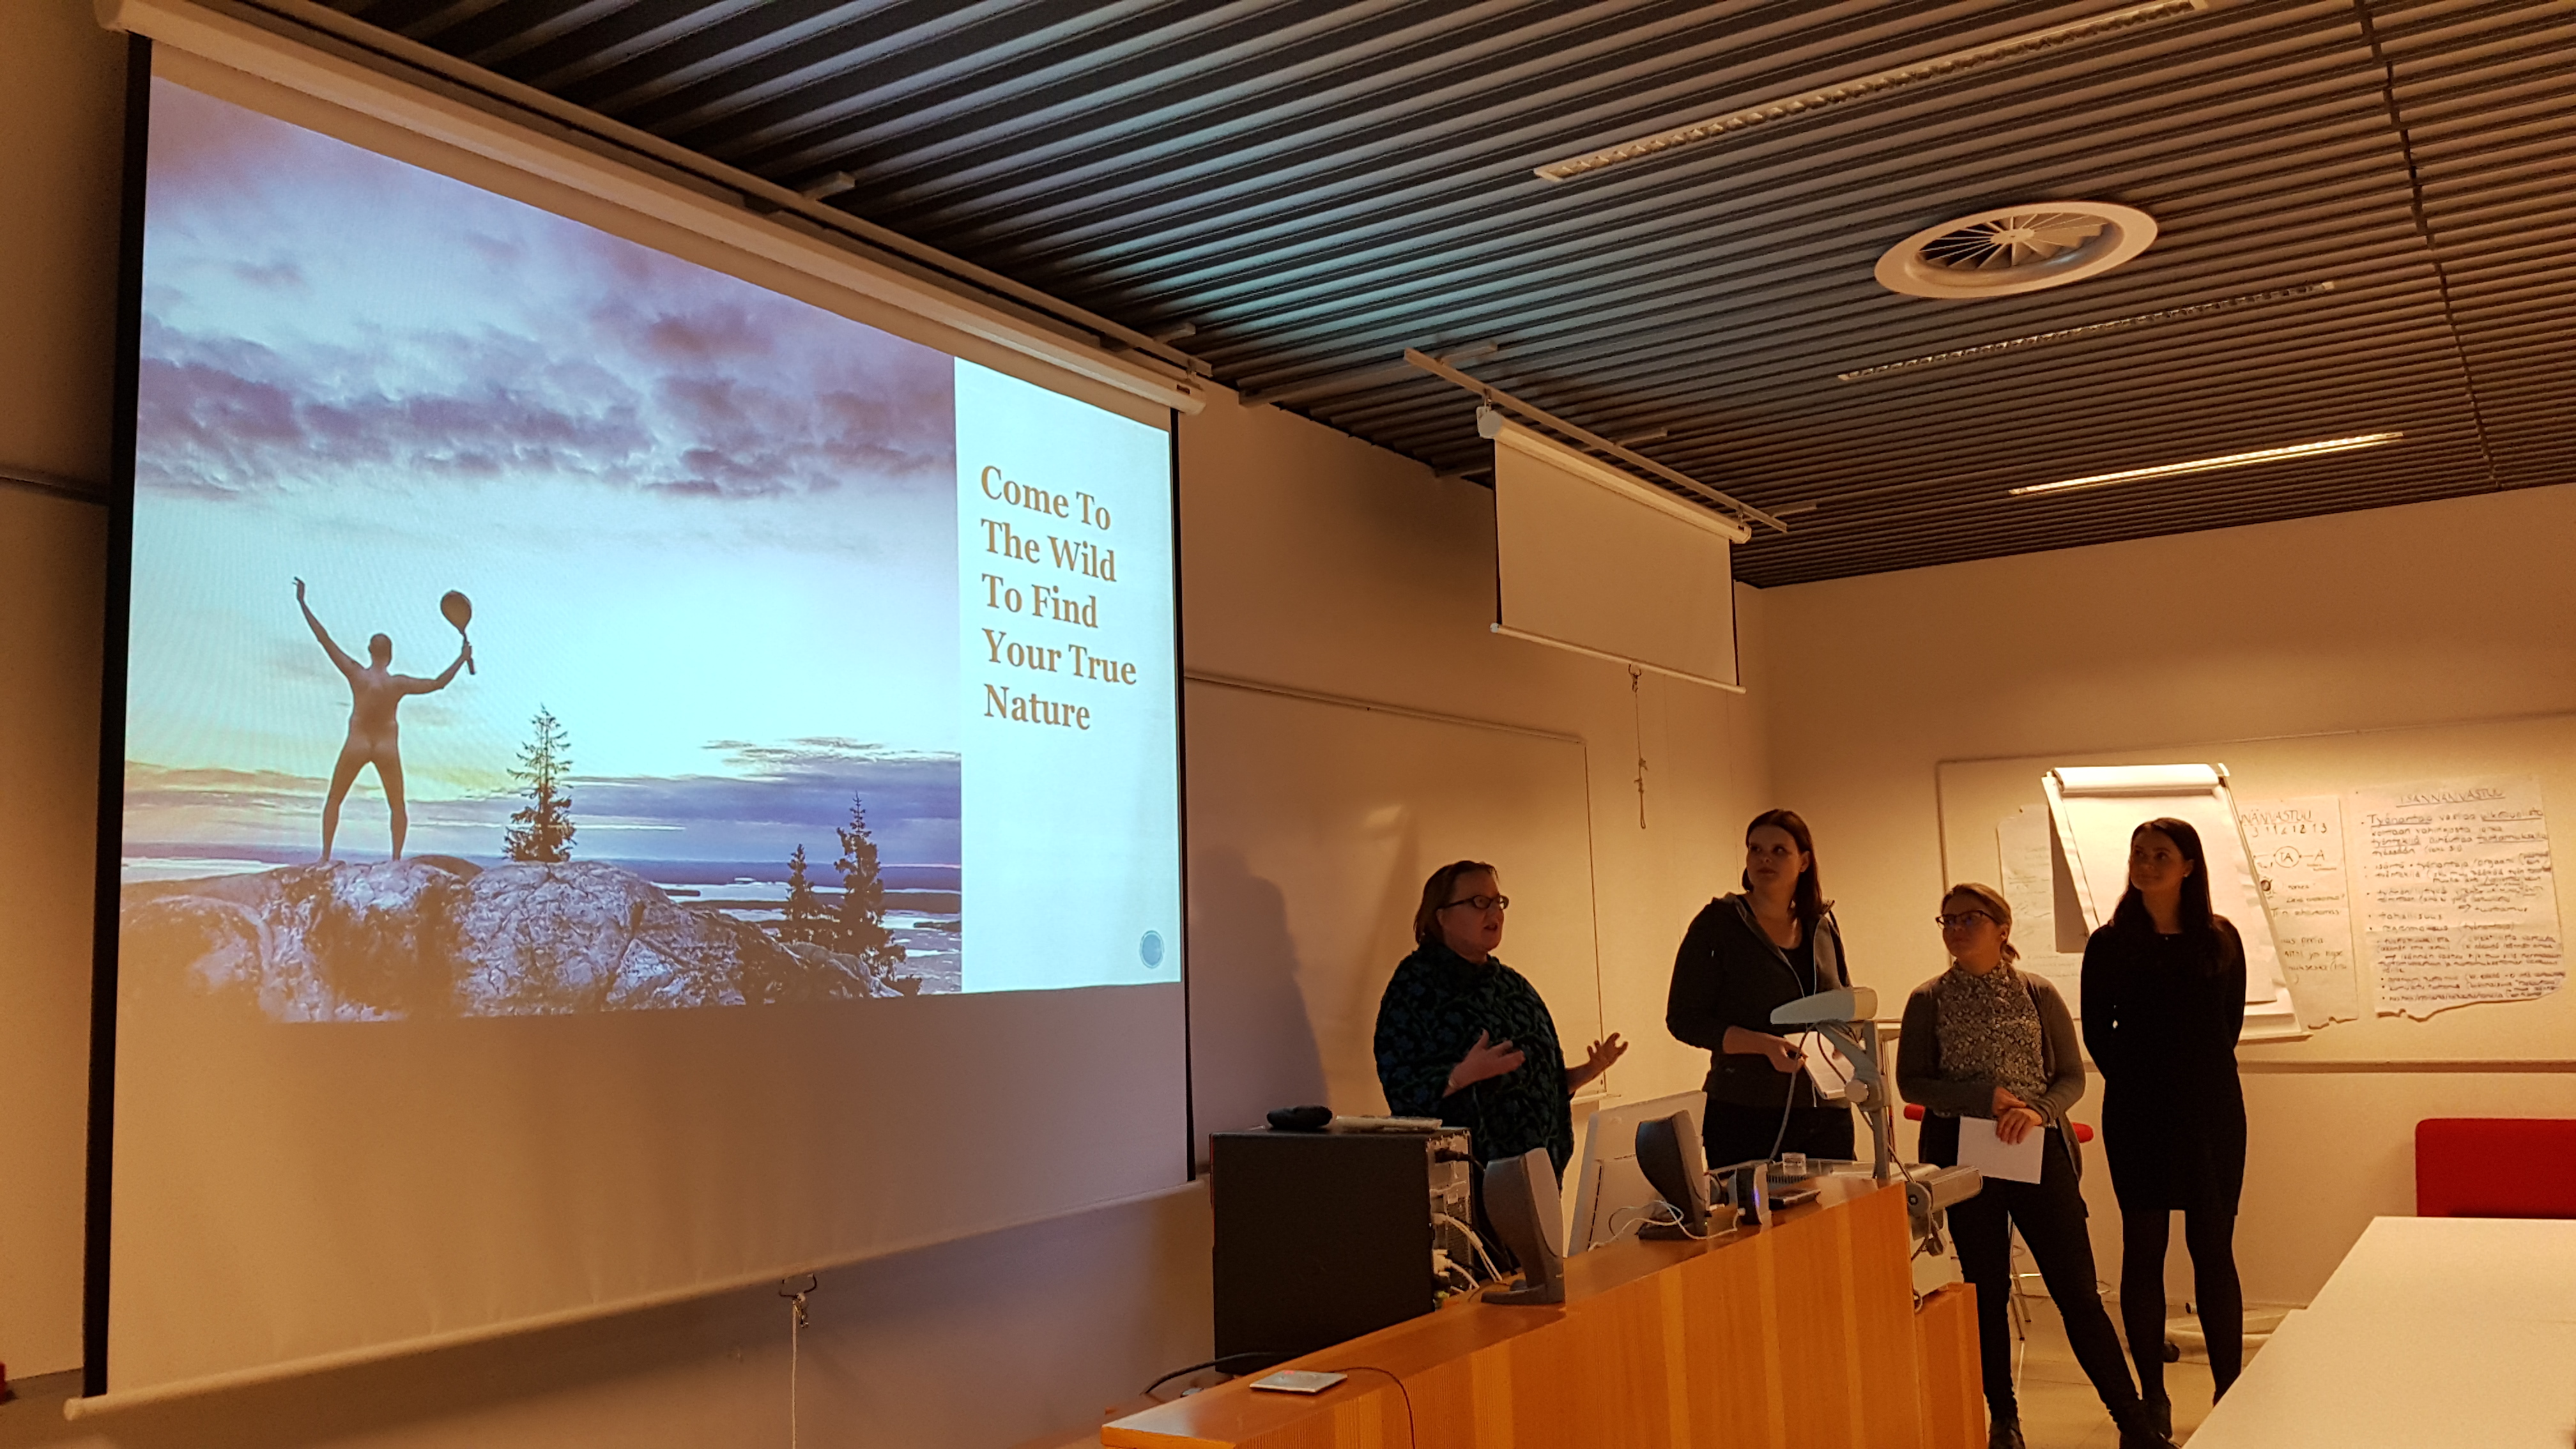
VisitKarelia Destination Destination Marketing Workshop with University of Eastern Finland

University of Eastern Finland (UEF) and Visit Karelia are partnering to develop destination marketing innovations for North Karelia region. This partnership is part of the Destination Marketing course at the International Master’s Degree Programme in Tourism Marketing and Management (TMM), at UEF Business School in Joensuu. VisitKarelia is the local destination marketing organization (DMO), focusing on raising awareness of North Karelia region as a tourism destination.

These destination marketing innovations are divided into three workshops. The first workshop focuses on destinations as media. In the second workshop, we examine what it means for a destination to be a marketplace. The third workshop then discusses what kind of experience North Karelia could be for a tourist.

We also want to invite tourism stakeholders to participate in the workshops with us. If you are working in the tourism industry, studying tourism, or interested in destination marketing you are most welcome to attend these workshops with us. If you are going to participate, please register at https://elomake.uef.fi/lomakkeet/25238/lomake.html two days before each seminar.

The timetable for the workshops is as follows:

24.02.20 AG106 Agora-building Monday 12.15-16.00: VisitKarelia Workshop: Destination as a Media
10.03.20 N101 Natura-building Tuesday 12.15-16.00: VisitKarelia Workshop: Destination as a Marketplace
17.03.20 CANCELLED Tuesday 12.15-16.00: VisitKarelia Workshop: Destination as an Experience

Language in the workshops will be English and they are held at UEF Joensuu campus (Yliopistonkatu 2).

Descriptions of the workshops:

Every workshop starts with a 30-minute keynote from VisitKarelia CEO Jaakko Löppönen and Head of e-tourism research Juho Pesonen, from UEF. They will frame the workshop topic from their own perspectives and provide instructions for the group works. After the keynotes and discussion, the participants are grouped together and in groups, they can develop answers to these workshop topics and questions. After two hours of working time each group will have five to ten minutes to present their ideas. At the end of the workshop, the best ideas are selected.

Destination as a Media

Marketing has moved mostly to digital channels, but it is often supported by other, traditional offline channels. In digital marketing, the importance of interesting content is emphasized. Consumers spend hours watching digital media with their mobile phones, tablets, computers, and other devices. There is constant competition on the attention of the consumers. Those brands and businesses that are able to create content that people pay attention to are also the ones that consumers remember the best when they are making decisions. Being a media that people want to consume increases the mental availability of the destination.

This increasing media usage in digital channels is also changing branding and destination marketing. Destinations cannot just rely on marketing campaigns aiming to promote various seasons in the tourism destination but have to be constantly in the minds of the consumers. This requires DMOs to transform from marketing organizations into media organizations. The key questions are for example:

  • With what resources content is created?
  • How to create interesting content?
  • What kind of content works the best?
  • How to distribute content in various channels?
  • How to analyze the success of media-based destination marketing?


Destination as a Marketplace

It is not enough that people are aware that the destination exists. They also need to be able to buy services and trips easily. When it is easier to buy tourism services, people are more likely to do so. Destinations need to think how they organize distribution so that it is the most convenient for the tourists to buy the services they are interested in. There are various possibilities to do that. Visit Rovaniemi is using Bokun platform to make booking services easier (https://www.visitrovaniemi.fi/fi/) and Turku is using Doerz to help people find interesting things to see and do in the region (https://fi.doerz.com/turku). How could Visit Karelia be a marketplace for tourism products or is it even reasonable for the DMO to be the platform? What other options are there to make it easier for consumers to buy tourism products and services they are interested in?


Destination as an Experience

It doesn’t matter how great a destination is in marketing or sales if the customer experience in the destination does not meet and surpass consumer expectations. Customer experience is the sum of dozens if not hundreds of encounters between the tourist and the destination and people living and working in the destination. Tourism businesses are responsible for staging memorable experiences for consumers. Destination marking needs to be able to identify those experiences and make sure the tourists find the best things to see and do in the destination. However, what is best for whom differs from one tourist to another. Also, destination brands need to be experienced in tourism services in the region. What would be the key things to improve in North Karelia region in order to ensure that the experiences tourists have in this region are ones that make them happy and delighted to tell others, not to mention coming back to the destination in the future.

Tourism Marketing and Management to start studying extraterrestrial tourists

Today is an excellent day to launch our new mission: we will focus now on how to make our world more hospitable for extraterrestrial tourists. There have been concrete sightings of UFOs for decades, clearly suggesting that we are constantly being visited by extraterrestrial aliens.

In 2017 we at Tourism Marketing and Management programme started educating postgraduate students at University of Eastern Finland with the mission of making tourism better. However, as a result of recent strategy meetings, we have identified an even more prominent research stream.

Research on extraterrestrial tourists

When we started looking into the topic it came as a bit of a surprise to us how little academic research could be found even remotely connected to intergalactic tourism. Sure, there are already academics studying space tourism, but this research is mostly focused on humans as tourists, like almost all other tourism topics before it. Based on the number of sightings Earth must be a popular tourist destination for aliens, but the academic literature on the topic is almost non-existent. This is what we now aim to change.

UFOs
Extraterrestrial tourists arriving

Various new research topics

There are several different topics that our research group and our students will start examining. First of all, we are interested in their travel motivations: why do the aliens undertake such long interstellar voyages to visit Earth? We are also interested in what makes them choose Earth among all the planets in the universe? What makes Earth so special? Understanding these topics helps us to better design our destination to meet traveller needs. Even though finding respondents for our survey might prove challenging we are close to signing a memorandum of understanding with NASA and hopefully will be able to interview our guests at Area 51. A new form of collaboration is needed to cater for the needs of these customers, as well as to rethink the traditional definitions of tourist destinations.

We will also study the sustainability of interstellar tourism by calculating the dark matter emissions of travelling to Earth from many of our major source markets. A global study will be conducted to calculate the economic impacts of extraterrestrial visits as well as what kind of effect the alien tourism has on our culture. The results should provide us with important knowledge to guide our marketing decisions to a more sustainable direction.

The search continues, now for tourism research purposes.

Unique postgraduate programme

This novel research stream will differentiate our programme and take it to the next level. This is evident with the success of our latest recruitment process. Professor April S.F. Ools (Ph.D.) will start developing cross-cultural marketing and management at our programme. We will be the only academic postgraduate programme to really see the big, intergalactic picture of tourism.

Understanding this seldom studied tourist group will contribute to our understanding of the world and offer novel insights into tourism as a research topic as well as an industry. The students graduating from our programme will be innovative out-of-box thinkers with unique intercultural communication capabilities and understanding.

Are you looking for an international tourism-focused master’s degree programme in business? Tourism Marketing and Management programme by University of Eastern Finland provides a unique learning experience for students who have finished their bachelor’s degree and are looking for new skills and knowledge in developing tourism industry in a sustainable way. Read more about the programme at www.uef.fi/tmm.


Overview of Quantitative Data Analysis Methods in SPSS

Analytical thinking in marketing is critical. If marketing is both art and science, the numbers play a big role in the science of marketing. In our Tourism Marketing and Management programme, we study analytical thinking in many courses. One of those is our Practical Tourism Research course. During the course, our students study big data, survey research, online data sets, experimental research and sensor technology as a source of quantitative data. Our main data analysis software is SPSS.

To help our students learn data analysis methods in SPSS, I have collected (From SPSS manual) functionalities and use examples for most common data analysis methods in SPSS. This provides a one-page overview of different data analysis methods and helps to find the correct one for different use cases. Hopefully, the reads of this blog will find this helpful!

SPSS Analyze path

Functionality

Example

Descriptive Statistics

Analyze -> Descriptive statistics -> Frequencies Provides statistics and graphical displays that are useful for describing many types of variables, how many of what are there in your data. The Frequencies procedure is a good place to start looking at your data. What is the distribution of a company’s customers by industry type? From the output, you might learn that 37.5% of your customers are in government agencies, 24.9% are in corporations, 28.1% are in academic institutions, and 9.4% are in the healthcare industry. For continuous, quantitative data, such as sales revenue, you might learn that the average product sale is $3,576, with a standard deviation of $1,078.
Analyze -> Descriptive statistics -> Descriptives Displays univariate summary statistics for several variables in a single table and calculates standardized values (z scores). Variables can be ordered by the size of their means (in ascending or descending order), alphabetically, or by the order in which you select the variables (the default). If each case in your data contains the daily sales totals for each member of the sales staff (for example, one entry for Bob, one entry for Kim, and one entry for Brian) collected each day for several months, the Descriptives procedure can compute the average daily sales for each staff member and can order the results from highest average sales to lowest average sales.
Analyze -> Descriptive statistics -> Explore The Explore procedure produces summary statistics and graphical displays, either for all of your cases or separately for groups of cases. There are many reasons for using the Explore procedure–data screening, outlier identification, description, assumption checking, and characterizing differences among subpopulations (groups of cases). The exploration may indicate that you need to transform the data if the technique requires a normal distribution. Or you may decide that you need nonparametric tests. Look at the distribution of maze-learning times for rats under four different reinforcement schedules. For each of the four groups, you can see if the distribution of times is approximately normal and whether the four variances are equal. You can also identify the cases with the five largest and five smallest times. The boxplots and stem-and-leaf plots graphically summarize the distribution of learning times for each of the groups.
Analyze -> Descriptive statistics -> Crosstabs The Crosstabs procedure forms two-way and multiway tables and provides a variety of tests and measures of association for two-way tables. The structure of the table and whether categories are ordered determine what test or measure to use. Are customers from small companies more likely to be profitable in sales of services (for example, training and consulting) than those from larger companies? From a crosstabulation, you might learn that the majority of small companies (fewer than 500 employees) yield high service profits, while the majority of large companies (more than 2,500 employees) yield low service profits.

Compare Means

Analyze- > Compare means -> Means The Means procedure calculates subgroup means and related univariate statistics for dependent variables within categories of one or more independent variables. Optionally, you can obtain a one-way analysis of variance, eta, and tests for linearity. Measure the average amount of fat absorbed by three different types of cooking oil, and perform a one-way analysis of variance to see whether the means differ.
Analyze- > Compare means -> One-Sample T Test The One-Sample T Test procedure tests whether the mean of a single variable differs from a specified constant. A researcher might want to test whether the average IQ score for a group of students differs from 100. Or a cereal manufacturer can take a sample of boxes from the production line and check whether the mean weight of the samples differs from 1.3 pounds at the 95% confidence level.
Analyze- > Compare means -> Independent Samples T Test The Independent-Samples T Test procedure compares means for two groups of cases. Ideally, for this test, the subjects should be randomly assigned to two groups, so that any difference in response is due to the treatment (or lack of treatment) and not to other factors. This is not the case if you compare average income for males and females. A person is not randomly assigned to be a male or female. In such situations, you should ensure that differences in other factors are not masking or enhancing a significant difference in means. Differences in average income may be influenced by factors such as education (and not by sex alone). Patients with high blood pressure are randomly assigned to a placebo group and a treatment group. The placebo subjects receive an inactive pill, and the treatment subjects receive a new drug that is expected to lower blood pressure. After the subjects are treated for two months, the two-sample t test is used to compare the average blood pressures for the placebo group and the treatment group. Each patient is measured once and belongs to one group.
Analyze- > Compare means -> Paired Samples T Test The Paired-Samples T Test procedure compares the means of two variables for a single group. The procedure computes the differences between values of the two variables for each case and tests whether the average differs from 0. In a study on high blood pressure, all patients are measured at the beginning of the study, given a treatment, and measured again. Thus, each subject has two measures, often called before and after measures. An alternative design for which this test is used is a matched-pairs or case-control study, in which each record in the data file contains the response for the patient and also for his or her matched control subject. In a blood pressure study, patients and controls might be matched by age (a 75-year-old patient with a 75-year-old control group member).
Analyze- > Compare means -> One-Way ANOVA The One-Way ANOVA procedure produces a one-way analysis of variance for a quantitative dependent variable by a single factor (independent) variable. Analysis of variance is used to test the hypothesis that several means are equal. This technique is an extension of the two-sample t test.

In addition to determining that differences exist among the means, you may want to know which means differ. There are two types of tests for comparing means: a priori contrasts and post hoc tests. Contrasts are tests set up before running the experiment, and post hoc tests are run after the experiment has been conducted. You can also test for trends across categories.

Doughnuts absorb fat in various amounts when they are cooked. An experiment is set up involving three types of fat: peanut oil, corn oil, and lard. Peanut oil and corn oil are unsaturated fats, and lard is a saturated fat. Along with determining whether the amount of fat absorbed depends on the type of fat used, you could set up an a priori contrast to determine whether the amount of fat absorption differs for saturated and unsaturated fats.

Compare Means

Analyze- > Compare Means-> Bivariate Correlations The Bivariate Correlations procedure computes Pearson’s correlation coefficient, Spearman’s rho, and Kendall’s tau-b with their significance levels. Correlations measure how variables or rank orders are related. Before calculating a correlation coefficient, screen your data for outliers (which can cause misleading results) and evidence of a linear relationship. Pearson’s correlation coefficient is a measure of linear association. Two variables can be perfectly related, but if the relationship is not linear, Pearson’s correlation coefficient is not an appropriate statistic for measuring their association. Is the number of games won by a basketball team correlated with the average number of points scored per game? A scatterplot indicates that there is a linear relationship. Analyzing data from the 1994–1995 NBA season yields that Pearson’s correlation coefficient (0.581) is significant at the 0.01 level. You might suspect that the more games won per season, the fewer points the opponents scored. These variables are negatively correlated (–0.401), and the correlation is significant at the 0.05 level.
Analyze- > Compare Means -> Partial The Partial Correlations procedure computes partial correlation coefficients that describe the linear relationship between two variables while controlling for the effects of one or more additional variables. Correlations are measures of linear association. Two variables can be perfectly related, but if the relationship is not linear, a correlation coefficient is not an appropriate statistic for measuring their association. Is there a relationship between healthcare funding and disease rates? Although you might expect any such relationship to be a negative one, a study reports a significant positive correlation: as healthcare funding increases, disease rates appear to increase. Controlling for the rate of visits to healthcare providers, however, virtually eliminates the observed positive correlation. Healthcare funding and disease rates only appear to be positively related because more people have access to healthcare when funding increases, which leads to more reported diseases by doctors and hospitals.
Analyze- > Compare Means -> Distances This procedure calculates any of a wide variety of statistics measuring either similarities or dissimilarities (distances), either between pairs of variables or between pairs of cases. These similarity or distance measures can then be used with other procedures, such as factor analysis, cluster analysis, or multidimensional scaling, to help analyze complex datasets. Is it possible to measure similarities between pairs of automobiles based on certain characteristics, such as engine size, MPG, and horsepower? By computing similarities between autos, you can gain a sense of which autos are similar to each other and which are different from each other. For a more formal analysis, you might consider applying a hierarchical cluster analysis or multidimensional scaling to the similarities to explore the underlying structure.

Generalized Linear Models

Analyze- > Generalized Linear Models -> Generalized Linear Models The generalized linear model expands the general linear model so that the dependent variable is linearly related to the factors and covariates via a specified link function. Moreover, the model allows for the dependent variable to have a non-normal distribution. It covers widely used statistical models, such as linear regression for normally distributed responses, logistic models for binary data, loglinear models for count data, complementary log-log models for interval-censored survival data, plus many other statistical models through its very general model formulation. A shipping company can use generalized linear models to fit a Poisson regression to damage counts for several types of ships constructed in different time periods, and the resulting model can help determine which ship types are most prone to damage.


A car insurance company can use generalized linear models to fit a gamma regression to damage claims for cars, and the resulting model can help determine the factors that contribute the most to claim size.


Medical researchers can use generalized linear models to fit a complementary log-log regression to interval-censored survival data to predict the time to recurrence for a medical condition.


Regression

Analyze -> Regression -> Linear Linear Regression estimates the coefficients of the linear equation, involving one or more independent variables, that best predict the value of the dependent variable. For example, you can try to predict a salesperson’s total yearly sales (the dependent variable) from independent variables such as age, education, and years of experience. Is the number of games won by a basketball team in a season related to the average number of points the team scores per game? A scatterplot indicates that these variables are linearly related. The number of games won and the average number of points scored by the opponent are also linearly related. These variables have a negative relationship. As the number of games won increases, the average number of points scored by the opponent decreases. With linear regression, you can model the relationship of these variables. A good model can be used to predict how many games teams will win.
Analyze -> Regression -> Binary Logistics Logistic regression is useful for situations in which you want to be able to predict the presence or absence of a characteristic or outcome based on values of a set of predictor variables. It is similar to a linear regression model but is suited to models where the dependent variable is dichotomous. Logistic regression coefficients can be used to estimate odds ratios for each of the independent variables in the model. Logistic regression is applicable to a broader range of research situations than discriminant analysis. What lifestyle characteristics are risk factors for coronary heart disease (CHD)? Given a sample of patients measured on smoking status, diet, exercise, alcohol use, and CHD status, you could build a model using the four lifestyle variables to predict the presence or absence of CHD in a sample of patients. The model can then be used to derive estimates of the odds ratios for each factor to tell you, for example, how much more likely smokers are to develop CHD than nonsmokers.
Analyze -> Regression -> Multinomial Logistic Regression Multinomial Logistic Regression is useful for situations in which you want to be able to classify subjects based on values of a set of predictor variables. This type of regression is similar to logistic regression, but it is more general because the dependent variable is not restricted to two categories. In order to market films more effectively, movie studios want to predict what type of film a moviegoer is likely to see. By performing a Multinomial Logistic Regression, the studio can determine the strength of influence a person’s age, gender, and dating status has upon the type of film they prefer. The studio can then slant the advertising campaign of a particular movie toward a group of people likely to go see it.
Analyze -> Regression -> Ordinal Regression Ordinal Regression allows you to model the dependence of a polytomous ordinal response on a set of predictors, which can be factors or covariates. The design of Ordinal Regression is based on the methodology of McCullagh (1980, 1998), and the procedure is referred to as PLUM in the syntax. Ordinal Regression could be used to study patient reaction to drug dosage. The possible reactions may be classified as none, mild, moderate, or severe. The difference between a mild and moderate reaction is difficult or impossible to quantify and is based on perception. Moreover, the difference between a mild and moderate response may be greater or less than the difference between a moderate and severe response.
Analyze -> Regression -> Probit This procedure measures the relationship between the strength of a stimulus and the proportion of cases exhibiting a certain response to the stimulus. It is useful for situations where you have a dichotomous output that is thought to be influenced or caused by levels of some independent variable(s) and is particularly well suited to experimental data. This procedure will allow you to estimate the strength of a stimulus required to induce a certain proportion of responses, such as the median effective dose. How effective is a new pesticide at killing ants, and what is an appropriate concentration to use? You might perform an experiment in which you expose samples of ants to different concentrations of the pesticide and then record the number of ants killed and the number of ants exposed. Applying probit analysis to these data, you can determine the strength of the relationship between concentration and killing, and you can determine what the appropriate concentration of pesticide would be if you wanted to be sure to kill, say, 95% of exposed ants.

Classify

Analyze -> Classify -> K-Means Cluster Analysis This procedure attempts to identify relatively homogeneous groups of cases based on selected characteristics, using an algorithm that can handle large numbers of cases. However, the algorithm requires you to specify the number of clusters. You can specify initial cluster centers if you know this information. You can select one of two methods for classifying cases, either updating cluster centers iteratively or classifying only. You can save cluster membership, distance information, and final cluster centers. Optionally, you can specify a variable whose values are used to label casewise output. You can also request analysis of variance F statistics. While these statistics are opportunistic (the procedure tries to form groups that do differ), the relative size of the statistics provides information about each variable’s contribution to the separation of the groups. What are some identifiable groups of television shows that attract similar audiences within each group? With k-means cluster analysis, you could cluster television shows (cases) into k homogeneous groups based on viewer characteristics. This process can be used to identify segments for marketing. Or you can cluster cities (cases) into homogeneous groups so that comparable cities can be selected to test various marketing strategies.
Analyze -> Classify -> Hierarchical Cluster Analysis This procedure attempts to identify relatively homogeneous groups of cases (or variables) based on selected characteristics, using an algorithm that starts with each case (or variable) in a separate cluster and combines clusters until only one is left. You can analyze raw variables, or you can choose from a variety of standardizing transformations. Distance or similarity measures are generated by the Proximities procedure. Statistics are displayed at each stage to help you select the best solution. Are there identifiable groups of television shows that attract similar audiences within each group? With hierarchical cluster analysis, you could cluster television shows (cases) into homogeneous groups based on viewer characteristics. This can be used to identify segments for marketing. Or you can cluster cities (cases) into homogeneous groups so that comparable cities can be selected to test various marketing strategies.
Analyze -> Classify -> Discriminant Discriminant analysis builds a predictive model for group membership. The model is composed of a discriminant function (or, for more than two groups, a set of discriminant functions) based on linear combinations of the predictor variables that provide the best discrimination between the groups. The functions are generated from a sample of cases for which group membership is known; the functions can then be applied to new cases that have measurements for the predictor variables but have unknown group membership.

Note: The grouping variable can have more than two values. The codes for the grouping variable must be integers, however, and you need to specify their minimum and maximum values. Cases with values outside of these bounds are excluded from the analysis.


On average, people in temperate zone countries consume more calories per day than people in the tropics, and a greater proportion of the people in the temperate zones are city dwellers. A researcher wants to combine this information into a function to determine how well an individual can discriminate between the two groups of countries. The researcher thinks that population size and economic information may also be important. Discriminant analysis allows you to estimate coefficients of the linear discriminant function, which looks like the right side of a multiple linear regression equation. That is, using coefficients a, b, c, and d, the function is:

D = a * climate + b * urban + c * population + d * gross domestic product per capita


If these variables are useful for discriminating between the two climate zones, the values of D will differ for the temperate and tropic countries. If you use a stepwise variable selection method, you may find that you do not need to include all four variables in the function.


Dimension Reduction

Analyze -> Dimension Reduction -> Factor Analysis Factor analysis attempts to identify underlying variables, or factors, that explain the pattern of correlations within a set of observed variables. Factor analysis is often used in data reduction to identify a small number of factors that explain most of the variance that is observed in a much larger number of manifest variables. Factor analysis can also be used to generate hypotheses regarding causal mechanisms or to screen variables for subsequent analysis (for example, to identify collinearity prior to performing a linear regression analysis).

The factor analysis procedure offers a high degree of flexibility:

• Seven methods of factor extraction are available.

• Five methods of rotation are available, including direct oblimin and promax for nonorthogonal rotations.

• Three methods of computing factor scores are available, and scores can be saved as variables for further analysis.


What underlying attitudes lead people to respond to the questions on a political survey as they do? Examining the correlations among the survey items reveals that there is significant overlap among various subgroups of items–questions about taxes tend to correlate with each other, questions about military issues correlate with each other, and so on. With factor analysis, you can investigate the number of underlying factors and, in many cases, identify what the factors represent conceptually. Additionally, you can compute factor scores for each respondent, which can then be used in subsequent analyses. For example, you might build a logistic regression model to predict voting behavior based on factor scores.
Analyze -> Dimension Reduction -> Correspondence Analysis One of the goals of correspondence analysis is to describe the relationships between two nominal variables in a correspondence table in a low-dimensional space, while simultaneously describing the relationships between the categories for each variable. For each variable, the distances between category points in a plot reflect the relationships between the categories with similar categories plotted close to each other. Projecting points for one variable on the vector from the origin to a category point for the other variable describe the relationship between the variables.

An analysis of contingency tables often includes examining row and column profiles and testing for independence via the chi-square statistic. However, the number of profiles can be quite large, and the chi-square test does not reveal the dependence structure. The Crosstabs procedure offers several measures of association and tests of association but cannot graphically represent any relationships between the variables.

Factor analysis is a standard technique for describing relationships between variables in a low-dimensional space. However, factor analysis requires interval data, and the number of observations should be five times the number of variables. Correspondence analysis, on the other hand, assumes nominal variables and can describe the relationships between categories of each variable, as well as the relationship between the variables. In addition, correspondence analysis can be used to analyze any table of positive correspondence measures.


Correspondence analysis could be used to graphically display the relationship between staff category and smoking habits. You might find that with regard to smoking, junior managers differ from secretaries, but secretaries do not differ from senior managers. You might also find that heavy smoking is associated with junior managers, whereas light smoking is associated with secretaries.

Reliability Analysis

Analysis -> Scale -> Reliability Analysis Reliability analysis allows you to study the properties of measurement scales and the items that compose the scales. The Reliability Analysis procedure calculates a number of commonly used measures of scale reliability and also provides information about the relationships between individual items in the scale. Intraclass correlation coefficients can be used to compute inter-rater reliability estimates. Does my questionnaire measure customer satisfaction in a useful way? Using reliability analysis, you can determine the extent to which the items in your questionnaire are related to each other, you can get an overall index of the repeatability or internal consistency of the scale as a whole, and you can identify problem items that should be excluded from the scale.

Are you looking for an international tourism-focused master’s degree programme in business? Tourism Marketing and Management programme by University of Eastern Finland provides a unique learning experience for students who have finished their bachelor’s degree and are looking for new skills and knowledge in developing tourism industry in a sustainable way. Read more about the programme at www.uef.fi/tmm.

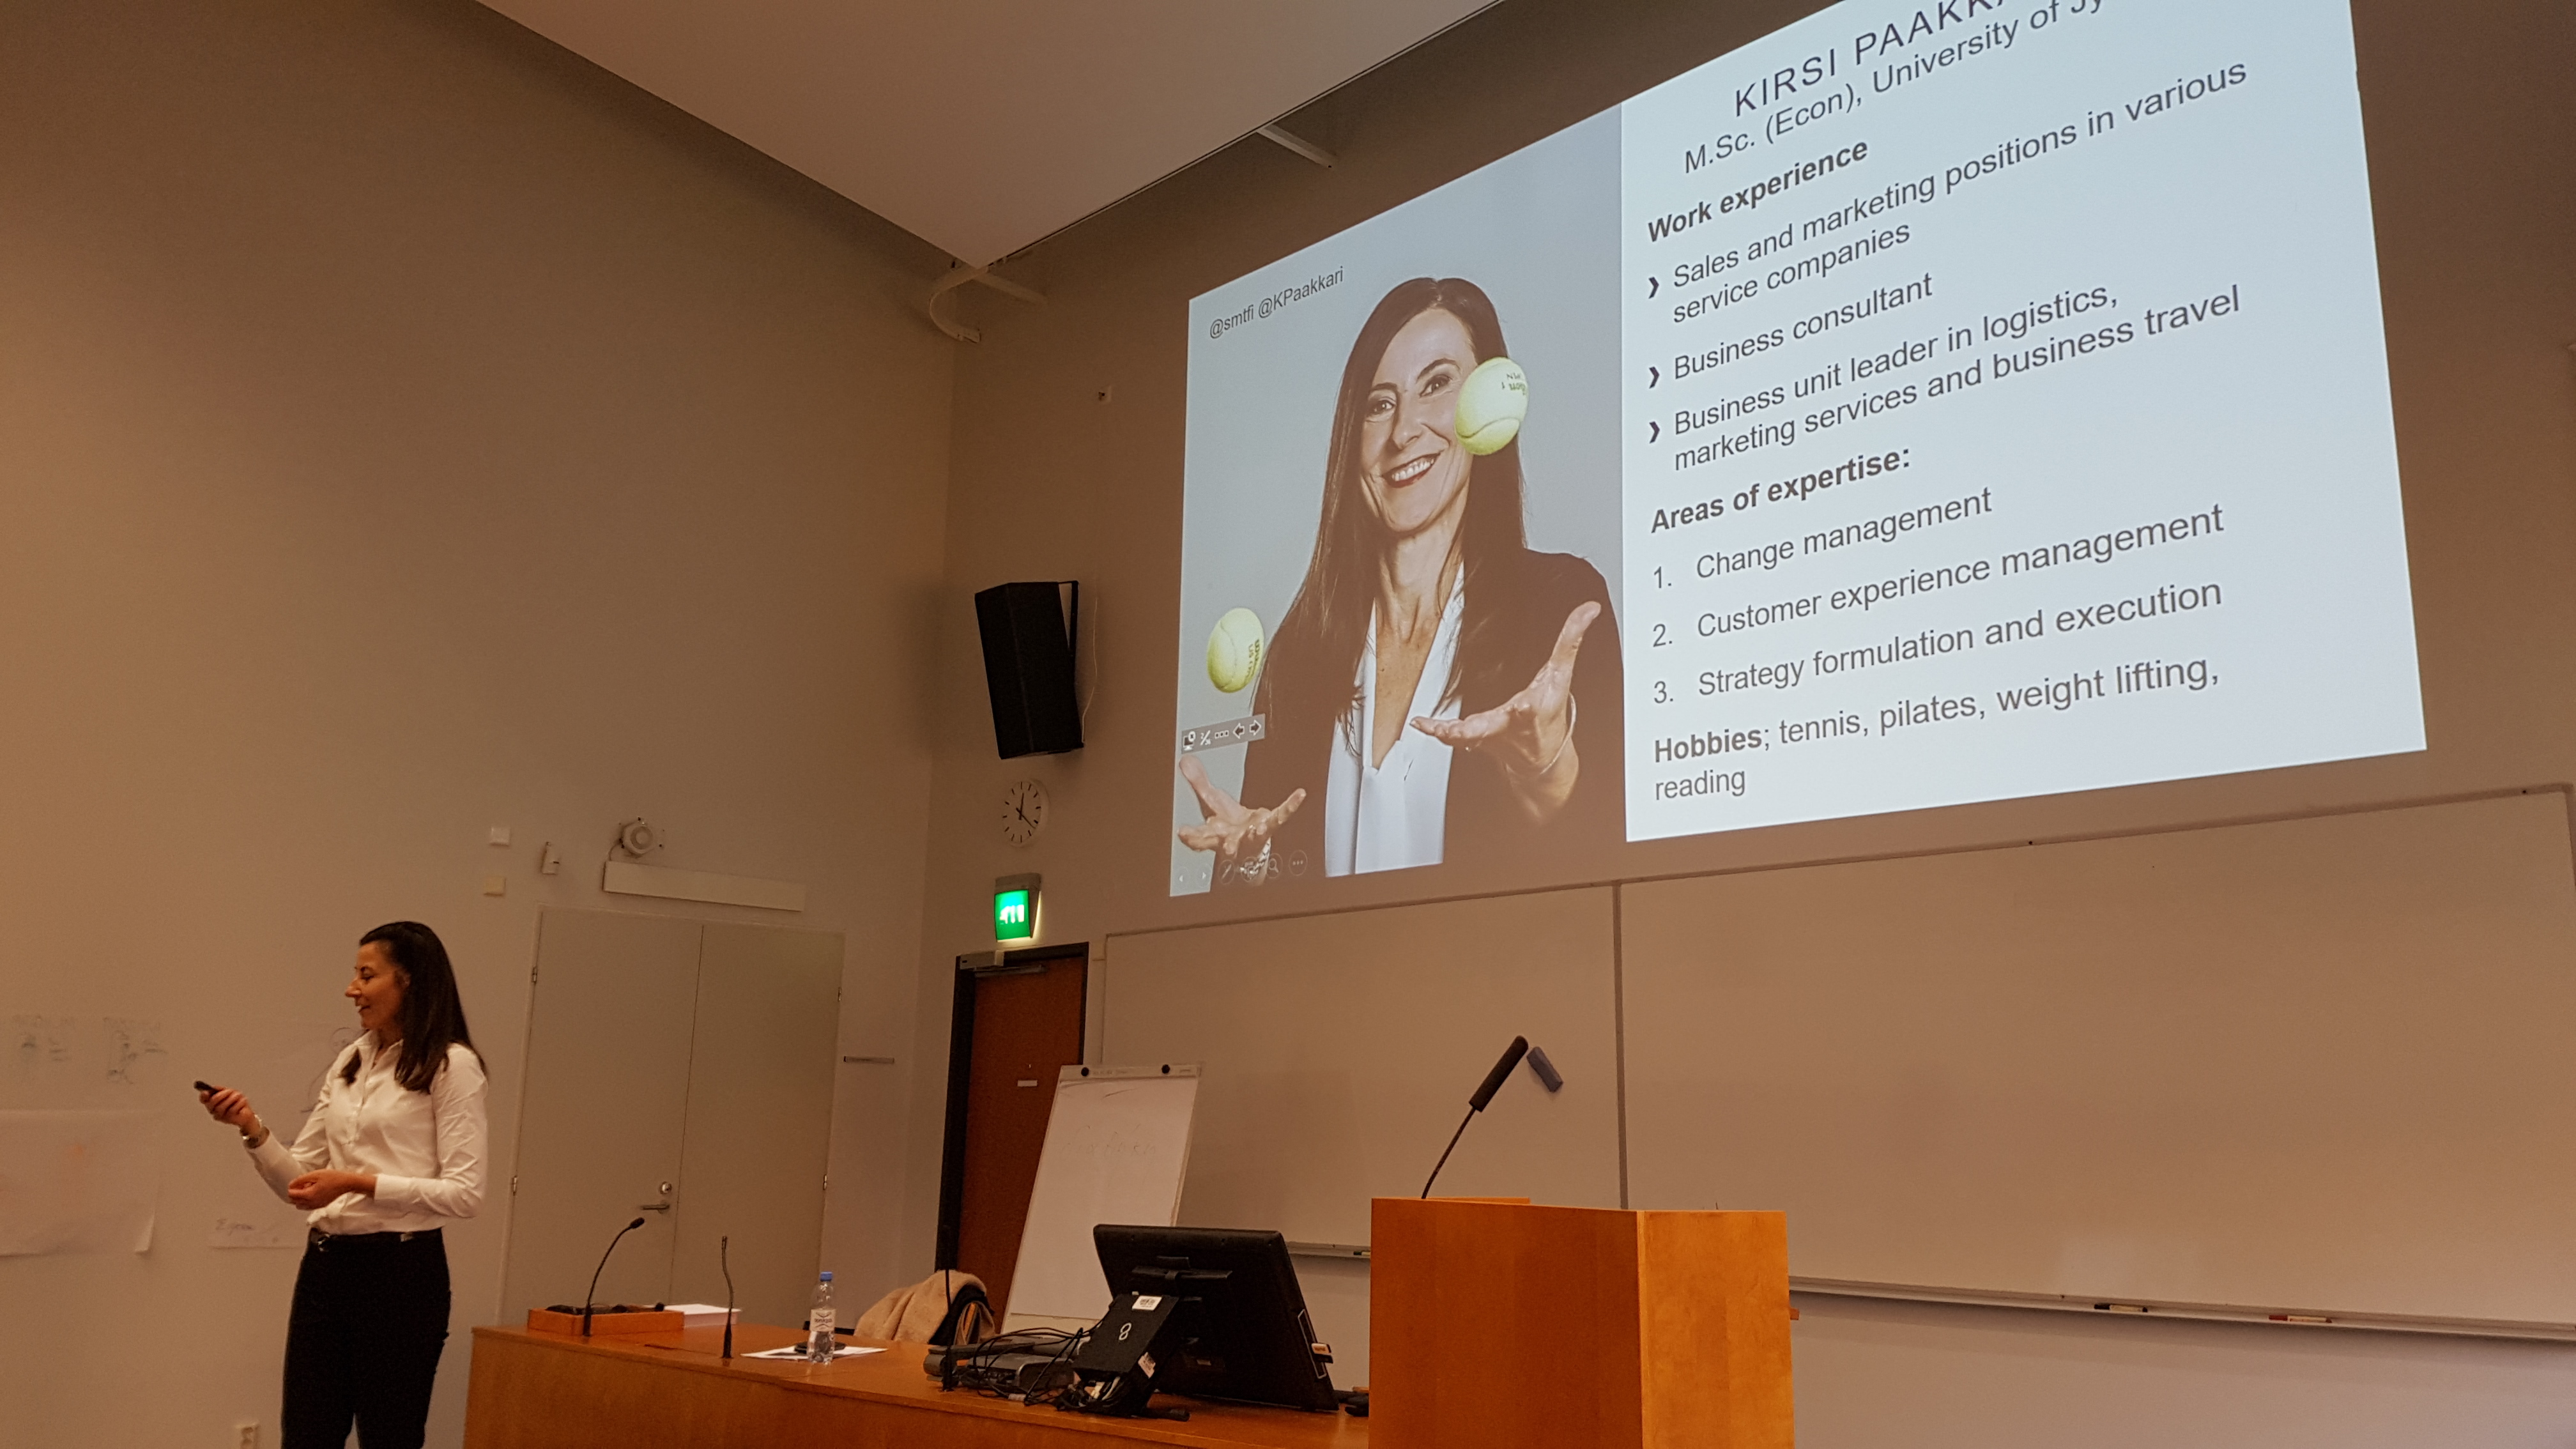
The next big wave in tourism marketing

*This article is written by Tourism Marketing and Management students Jonna Kumpu and Tiina Kattilamäki

The second #IFITTtalk @Helsinki seminar on Digitalization in Tourism business was held at Hotel Arthur on Tuesday 15th of May. The seminar was opened by Kari Halonen from ToolBox Ltd, who was also the main organizer of the day. The opening speech was given by Juho Pesonen from the University of Eastern Finland, who has his thoughts on digitalization and customer experience. It is especially this focus on the customer experience that will be changing tourism marketing on a profound level in the future. Of course, the experience has always been important in tourism, but now with social media and the importance of earned media and technological development, customer experience will be the key to success in tourism. It was also the focus of this IFITTtalk seminar. 

Multisensory experience is the future of tourism marketing

During the day, we got to listen to several speakers and their thoughts and best practices concerning digitalization in the tourism field. One of the most interesting speeches was given by Pasi Tuominen from Haaga-Helia University of Applied Sciences. He emphasized the multisensory approach to tourism services in which all senses are being utilized. For example, in the hotel room of the future customers are able to select in what kind of eenvironmentthey want to fall asleep by using an app on their mobile phone. In multisensory approach spaces, surfaces, smells, and voices are all being utilized. Essi Prykäri from Lahti University of Applied Sciences emphasized the importance and possibilities of 360° Virtual Reality videos, for example in marketing nature tourism. This has also been done for example by SaimaaLife in the Savonlinna region, which we got the pleasure to get to know earlier in the spring when she visited our programme.

Tourist experience captivating the audience

Jarno Malaprade from Tietotalo talked us through the evolution of mobile phones and reminded us of the fast development that has happened during the last few decades. Our phones have transformed from normal mobile phones to personal assistants, and the transformation continues. Jarno also introduced us more closely to beacons, which are Internet-of-Things devices that can be utilized easily in various ways in tourism businesses. The beacons can help businesses to for example guiding customers in certain areas such as theme parks, which tend to get busy at times. The beacons are aware of the presence of the user and can be used to collect all different sorts of data to help in experience design.

Heini Niklas-Salminen from TourGuideFox presented their company’s app, which offers digitally guided city tours. The company has started tours recently in Helsinki but is planning to expand in the future. Heini gave some insights for features of successful apps. It has to be easy to buy, modified to different target groups and that customer experiences are at the core of service. TourGuideFox aims to be more than just another city tour app; there is a possibility to build a whole ecosystem based on creating more value for tourists when they are on the trip.


The development of AI and robotization in tourism

The speeches were finalized by Iis Tussyadijah, the President of IFITT, who joined the seminar online. She emphasized the importance of AI and robotics, as services will be robotized in the future. According to her, this change will also greatly affect tourism business. It will bring both opportunities and challenges, and tourism industry should be ready to optimize the benefits and minimize the risks.

The afternoon continued with workshops on digitalization. Also, we got to familiarize ourselves with the exhibitors, who introduced their companies. The companies included were Tripsteri, Qvick, Koodiviidakko, HMMH Consulting, Wowanders, and Poutapilvi. Also, the company representatives had a chance to participate in workshops concerning digitalization held by Juho Pesonen.

The main notion of the day is that tourism businesses can profit greatly from digitalization. It will make the travelers’ lives easier, but also the travel experience certainly a lot more interesting. It became apparent during the day that many companies already use different kinds of applications in order to offer new services, but there is still a lot to be done. However, the question remains whether the virtual reality will never be able to replace real experiences. Does it even have to, or should it be more like an addition to the actual experiences that the traveler may face?

Participants were really enthusiastic about the day’s topic and were eager to share their knowledge and tell about their business ideas. Everyone certainly finished the day with inspiration and new ideas to be utilized in the future.  All in all, the day proved that there definitely is a place for a seminar like this also in the future. It is fantastic that IFITT is supporting events such as this and enables tourism industry to benefit from digitalization and share ideas and best practices.


#digitalization #technology #AI #tourism #IFITTtalk #IFITT #hotelarthur #tmm #helsinki #maketourismbetter

Get a master’s degree in tourism business

Are you looking for an international tourism-focused master’s degree programme in business? Tourism Marketing and Management programme by University of Eastern Finland provides a unique learning experience for students who have finished their bachelor’s degree and are looking for new skills and knowledge in developing tourism industry in a sustainable way. Read more about the programme at www.uef.fi/tmm.

TMM developing tourism business at Etelä-Konnevesi region

Our International Master’s Degree Programme in Tourism Marketing and Management (TMM) has started a collaboration with municipalities of Konnevesi and Rautalampi and tourism stakeholders in the region. The concrete first step in this collaboration was a two-day workshop on developing nature tourism in the Etelä-Konnevesi region, organized in Konnevesi research station 14.-15.3.2018. Together with Anne Hyvärinen, project manager at a regional tourism development project, two days full of tourism business content were designed and tailored for the region.

Tourism insights and knowledge

The idea of the first day was to bring in all the actors to the same level when it comes to tourism marketing and management in a nature tourism destination. The day started with introductions and three short group work presentations by our students. As a preliminary assignment, our students had examined how the region is represented on the Internet from the perspective of potential tourists, both domestic and international. They also gave a quick overview of the recent development of the region in combination with development possibilities.

Making tourism better
Nature tourism workshop at Etelä-Konnevesi region

From the student presentations, it became obvious that the region has a vast tourism potential, but the problem is that very few know about this hidden gem. Most tourists that come to the region just visit the Southern-Konnevesi National Park, even though the region is full of interesting, high-quality and distinctive tourism businesses. Thus we were able to pinpoint the tourism development problem to marketing and sales, as well as networking between the actors in the region.

Besides our students, there was a wide range of presentations from local entrepreneurs and tourism personnel, Jyväskylä UAS and Visit Jyväskylä, and Johku. The tourism in the region and development possibilities were discussed from many different viewpoints, providing a great overview of the topic.

Networking and collaboration

At the end of the first day, we had the chance to visit a local rural tourism business Suopirtti Highland and meet their “hairy cows” (ie. highland cattle). It was indeed an experience for all of us. Afterward, we had a chance to taste delicious locally produced dishes at restaurant Mierontie. The restaurant also had a unique, wooden interior design made by local Jukola Industries. At the end of the second day, we had the chance to visit the National Park and experience KalajaRetkeily hospitality from Markku Utriainen. These visits only reinforced our view that there are many great and original tourism products and services in the region, but very few have ever heard of them.

Tourism services at Etelä-Konnevesi
Local tourism services

Professor Raija Komppula emphasized at the workshop how important collaboration and networking are for tourism businesses. Not that much can be achieved by doing things alone. Tourists seldom choose a destination based on one tourism business. Tourists are looking for an amalgam of experience that they can enjoy during their trip and only by working together a region can provide tourists what they want.

Tourism business development

Our students are now working with individual tourism businesses as their second assignment. Each student was assigned with a tourism business with their own development possibilities. The businesses gave our students practice-oriented tasks connected to topics such as marketing mix development, service packaging, experience design, technology adoption and new-service development. Our students will provide each involved business a short report that guides the businesses to take the next steps.

Students in a nature trail
TMM students and staff at the Etelä-Konnevesi National Park

Collaboration with TMM

We have built our programme so that this kind of destination and business collaborations are possible. Our students performed really well during the workshop and have clearly learned a lot during this past year they have been studying with us. We will continue our collaboration with Etelä-Konnevesi region and are also open to new possibilities to make tourism better. If you are interested in collaboration, please contact me at juho.pesonen[at]uef.fi.

Management by wellbeing

Mindfulness, victorious corporate culture, growth rates that the board cannot accept, going to the gym with your bosses, hiring a personal business coach, fighting loneliness… does not sound like a traditional Finnish management style, does it? In one company it is.

Managing corporate culture and people at SMT

Our Tourism Marketing and Management Programme had the privilege to have CEO of travel and event agency SMT Kirsi Paakkari as a guest speaker to discuss with us about managing corporate culture and people in a way that enables a tourism business to grow.

tourism business management
Kirsi Paakkari discussing corporate culture in tourism

She has successfully merged two ill-performing businesses into a victorious one in a shrinking market, not an easy feat at all. It requires a lot from a manager to change the direction of a business and reach double-digit growth rates. Sometimes traditional Finnish management by perkele (traditional Finnish curse word) style might just not do it. Managers make many choices that define company performance.

Focus on employees management

Kirsi has clearly chosen to focus on the employees of the company. It was great to see how she monitors and leads the wellbeing of her people. She is also managing her company with metrics and data as much as possible while still listening to people. This might be the only way to reach her goal, which is to make SMT the best service company in Finland. This goal is also dependent on trust. Leadership requires trust in many forms. Employees have to trust their leaders and trust in the future of the company. In addition, the manager has to trust the employees, why hire people you cannot trust?

tourism marketing and management
Management education for students

Our student Lari Turunen appreciated how Kirsi decided to bring new people from outside the industry to create new ideas for the company. Lari also noted that when you are building a new culture for a company you have to invest in it. Mergers should not be only about saving money and making companies more efficient but they should also be seen as an opportunity to start anew.

Management by employee wellbeing is similar to human sigma management and has a sound basis in academic literature. There are many challenges ahead for SMT as they integrate with American Express Global Business and are more and more focusing on a growing event market. It will be interesting to see how the company manages these changes and how management by wellbeing works in the future. Could it be the direction of future leadership in Finland or even globally?

Get a master’s degree in tourism business

Are you looking for an international tourism-focused master’s degree programme in business? Tourism Marketing and Management programme by University of Eastern Finland provides a unique learning experience for students who have finished their bachelor’s degree and are looking for new skills and knowledge in developing tourism industry in a sustainable way. Read more about the programme at www.uef.fi/tmm.

Tourism Marketing and Management programme takes novel approach to business studies

A business degree that specialises in tourism business is now available for the first time in Finland. Running at the University of Eastern Finland Business School, the international Master’s Degree Programme in Tourism Marketing and Management has got off to a good start, as 20 new students started at the Joensuu Campus this September.

Their studies began with an orientation week focusing on the programme’s four main themes: technology, well-being, nature and sustainability. Visits to the Puukarin Pysäkki guest house and the Murtovaara Forest Farm Museum, both located in a small town in eastern Finland, were particularly enlightening experiences. These destinations summarise well the potential and challenges of tourism in places like the eastern part of Finland.

The programme brings together academic studies and real-life links with working life in many different ways.

“It has been nice to notice how interested companies have been in our programme and students right from the start. Already in early September, our students did a Sales Race event in collaboration with the North Karelia Cooperative,” Programme Director Juho Pesonen says.

Co-operation with tourism businesses
Sales Race teaching practical selling skills

The Master’s degree programme has a unique advisory board consisting of representatives of business and industry, and the task of this advisory board is to make sure that the content of the programme and its courses are in line with working life requirements. Students also learn practical marketing skills by participating in the programme’s marketing.

Collaboration is the key to successful tourism marketing

The significance of collaboration is highlighted in the programme in many ways.

“We focus on collaboration rather than competition, and collaborative learning and problem-solving is encouraged in many different ways. We do plenty of group work on our courses and make use of collaborative learning methods that are independent of time and place,” Pesonen says.

The programme’s novel approach also applies to teaching, as the number of traditional lectures has reduced thanks to the introduction of flipped classroom. Students are largely responsible for their own learning process, and this process is supported by different kinds of assignments given during contact sessions as well as by in-depth discussion of the most difficult content.

The programme’s smooth start has also been aided by Professor James Murphy from Australia, who was recently appointed as a docent of the University of Eastern Finland. He brings an international angle to the first course, and visiting scholars and teachers from all over the world will be contributing to the programme.

The goal of the programme is to train experts who are valued by employers and the scientific community alike. The programme places emphasis not only on content learning, but also on important working life skills such as critical thinking, taking initiative, can-do attitude, independent and lifelong learning, and team work.

“A good example of this is a campaign our students designed and implemented at the university on World Tourism Day on 27 September to raise awareness of sustainable tourism.”


Tourism Master's Degree in Business
Study Tourism Marketing and Management at UEF.

Admissions to the international Master’s degree programmes of the University of Eastern Finland will be open between 1 November 2017 and 31 January 2018.


For further information, please contact:

Programme Director Juho Pesonen, tel. +358 40 184 2698, juho.pesonen(at)uef.fi


For more information on the Master’s Degree Programme in Tourism Marketing and Management, please see http://www.uef.fi/web/tmm.

Study tourism business at UEF: Master’s Degree Programme in Tourism Marketing and Management

There are dozens of reasons why you should study Tourism Marketing and Management at University of Eastern Finland. Here are 16 top reasons to study with us:

  1. High quality studies

We aim to keep the quality of our studies high. Our studies are not the easiest; there are no free credits but a lot to learn. You will have to work hard, but when you work, you can be sure that the things you learn really matter after your graduation. We are using innovative teaching methods that inspire and motivate you to give 100 % to the programme and to develop your skills and career.

  1. Focus on students

We value every student who applies for our programme. This degree programme would not exist without you students. We constantly listen to what you have to say, have a large number of feedback channels and methods and act accordingly to the feedback we receive. We take good care of our students, keep track of how their studies are progressing and help them to learn what is required and get their degree.

Travel and tourism studies
Studying tourism
  1. Co-operation with destinations and tourism companies

We are networked with various destinations and tourism businesses in Finland. Our network makes it possible for us to knit our courses to real-life business goals. All our courses programme courses have business partners and actual business case studies that we use to test what you have learned and deepen your knowledge on what is required after you have received your degree. Our programme is supervised by an industry advisory board that ensures that the skills and knowledge in our programme is up to date and relevant.

See our advisory board and partners.

  1. Academic research

Our programme has a strong research focus. Right from the start, you will start to familiarize yourself with academic research and prepare for writing a master’s thesis. Thinking that is required to do academic research is similar to the line of thinking that businesses value. We need to be critical of information we receive, understand the meaning of it for business practices and try to find new approaches to marketing and management.

See our research here.

  1. Unique focus topics

Wellbeing, nature tourism, sustainable tourism and technologies are all globally trending topics and form a strong and unique focus for our programme. This profiling should also be reflected on our students who are interested in the outdoors, wellbeing of people and planet and enthusiastic about new technologies. We do not train hotel managers or hospitality professionals but focus on developing tourism business in destination management organizations, tourism businesses and in public sector.

  1. High ranking university, internationally recognized

UEF is among top 50 of World’s Top Young Universities and within the top 500 of all world’s universities. We are internationally recognized research university that aims to solve global problems. See our rankings at http://www.uef.fi/en/web/guest/uef/international-rankings and university strategy at http://www.uef.fi/en/web/guest/uef/strategy

  1. Finland and Finnish education system

Finnish education system is world-renowned and our national higher education system is the 6th best in the world (http://www.universitas21.com/article/projects/details/152/u21-ranking-of-national-higher-education-systems-2017). Finland is one of the best countries in the world to live in (rank 21 http://hdr.undp.org/sites/default/files/2016_human_development_report.pdf) and safest country on the planet. Finland is also rapidly increasing in popularity among international tourists. With its four seasons, living in Finland can be an exotic experience. For more information about Finnish education system visit http://minedu.fi/en/education-system

  1. Student satisfaction

Finland and UEF are not world leaders when it comes to the number of international students we receive. However, the students who do come to Finland, tend to be extremely satisfied with their choice: https://www.studyportals.com/intelligence/international-student-satisfaction/international-student-satisfaction-awards-2016/.

  1. Flipped learning

One of the innovative teaching methods we use is Flipped learning. We do not believe that centuries old method of lecturing in front of the class when students listen is the most efficient way of teaching things. Most of our courses are utilizing flipped learning methodology where the traditional roles of lectures and homework are reversed. This means that learning is flexible and happens mostly online with material prepared by the teacher. We focus on learning, not just that you have to get credits and pass through courses. We do not have many exams but learning is measured with various tasks and team works. You will not submit essays and assignments only for the lecturer to read but will be producing valuable social media content right from the beginning to benefit the whole industry as well as the programme.

Learn more about flipped learning.

  1. Small, tight knit and relaxed group

We have a common goal, to make our programme better known. The TMM staff and students are more like colleagues than students and professors. There are only four people working in the programme so you will get to know them well before you get your degree. We encourage our students to co-create learning and do things together. We only accept around 15 new students each year; finishing our programme is a team effort. Teams and networks are increasingly important in modern work life and we provide our students tools and skills to be a productive team member.

  1. City of Joensuu

Our programme is based in a small city in Eastern Finland called Joensuu. We think that Joensuu is a perfectly sized city; it has everything you need but is surrounded by nature from all sides. It has good train and air connections to Helsinki from where you can continue anywhere in the world.

Visit Joensuu and Karelia Expert websites for more information.

  1. Career for the future

Work life is changing. Technological development in artificial intelligence and robotics are affecting how we work in the future. Many of the jobs people will work in in 2030 do not exist yet. Still at least for some time creativity and innovativeness will be the strengths of the human mind. We will train your mind to be useful for various development tasks in the tourism industry and provide insights how you can keep your skills relevant in the decades to come.

  1. Learning environment

UEF aims to provide its students the best academic learning environment in Finland. We have identified the development of our learning environments as one of our most important goals. The best academic learning environment in Finland is built around innovative teaching methods, research-based education, diverse use of facilities, and transparency.

Under the lead of our motivated teachers, we are creating a new culture of teaching. The teaching we offer is of a high standard and based on the latest research findings, enabling us to train professionals for the needs of the rapidly changing working life. We support this process by renewing our campus facilities with flexibility, inspiration and technology in mind.

At UEF, we want to create a culture of open science and technology that enables seamless collaboration between our students’ own devices and the devices and technology provided by the university.

From day one, we want to make our students feel welcome as new members of the scientific community. We invest in supporting flexible study paths, and to this end, we have created a new digital environment, Kamu, for our students.  Our work to develop our learning environments is rooted in student-centeredness. Together, we are building a university of tomorrow.

https://www.uef.fi/en/learning-environments

  1. Doctoral studies

For successful students we provide opportunities to continue their education with doctoral studies. Our doctoral students have opportunities to work in the department in various research and development projects and have wide selections of courses available for their studies. Doctoral studies are free for those accepted for the programme and we even have a few paid positions available.

  1. Costs and scholarship

Our programme is free for European and Finnish students. For students coming from outside EU/ETA region the annual study fee is 8000 €. We provide the best international applicant’s 80 % to 100 % scholarships for our programme. Studying in Joensuu is also cheaper than in metropolitan cities as living costs are lower.

  1. We make tourism better

We are not only educating tourism professionals of the future but we aim to have a wider impact on tourism. Our goal is to make tourism better through our actions and through our students who will work in the industry. Better for local people, better for tourists better for planet and better for tourism research and tourism industry.

Click here to see how to apply for the programme.

Peer-to-peer accommodation and sharing economy from tourists’ perspective

Airbnb has become one of the largest accommodation companies in the world if counted by the rooms available. Its rapid growth has been enabled by a phenomenon known as sharing economy. People are less inclined to own things and are getting used to share what they own with other people. Peer-to-peer accommodation happens when a person rents an apartment or a room they own to other person and this is typically enabled by digital platforms such as Airbnb. We wanted to study how this peer-to-peer accommodation phenomenon is shaping tourist behavior results from three different studies are now available online, elaborating what is important in peer-to-peer accommodation from traveler perspective.

Sharing economy and peer-to-peer accommodation
Source: https://intelligence.slice.com/airbnb-bookings-59-percent-muted-major-markets/

How is peer-to-peer accommodation shaping travel behavior?

In the first study we found out that sharing economy and peer-to-peer accommodation especially are good for tourism destinations. Availability of peer-to-peer accommodation enables wider selection of destinations for tourists, increase length of stay, travel frequency and number of activities tourists participate in the destination. Especially travelers’ desires for more meaningful social interactions with locals and unique experiences in authentic settings drive them to travel more often, stay longer, and participate in more activities.

Tussyadiah, I. P., & Pesonen, J. (2016). Impacts of peer-to-peer accommodation use on travel patterns. Journal of Travel Research, 55(8), 1022-1040.

What drives and hinders peer-to-peer accommodation use?

In the second study we explored the market characteristics and the factors that drive and hinder the use of P2P accommodation to better explain the phenomenon of collaborative consumption in the tourism and hospitality marketplace. Using responses from travellers residing in the United States and Finland, exploratory factor analyses revealed two factors that drive the use of P2P accommodation: social appeal (desire for community and sustainability) and economic appeal (cost savings). The barriers include issues of trust, efficacy and familiarity with the system, and cost.

Tussyadiah, I. P., & Pesonen, J. (2016). Drivers and barriers of peer-to-peer accommodation stay–an exploratory study with American and Finnish travellers. Current Issues in Tourism, 1-18.

Airbnb and sharing economy is shaping tourism
Peer-to-peer accommodation

What kind of peer-to-peer accommodation users there are?

In the third study we examined the drivers of peer-to-peer accommodation in more detail and focused on different P2P accommodation user groups. We found out that the major drivers affecting the use of P2P accommodation services are the age of consumers, active use of the Internet and online technologies, and the frequency of international travel. Cluster analysis identified two user profiles corresponding to consumer motivations for using P2P accommodation services. The first consumer group uses P2P accommodation services to make their trips more convenient, while the second uses them mostly for social reasons.

Pesonen, J. & Tussyadiah, I. (2017). Peer-to-peer accommodation: drivers and user profiles. In Dredge, D., & Gyimóthy, S. (Eds.) Collaborative Economy and Tourism. Perspectives, Politics, Policies and Prospects. Springer. pp. 285-303. http://www.springer.com/gp/book/9783319517971

Get a master’s degree in tourism business

Are you looking for an international tourism-focused master’s degree programme in business? Tourism Marketing and Management programme by University of Eastern Finland provides a unique learning experience for students who have finished their bachelor’s degree and are looking for new skills and knowledge in developing tourism industry in a sustainable way. Read more about the programme at www.uef.fi/tmm.

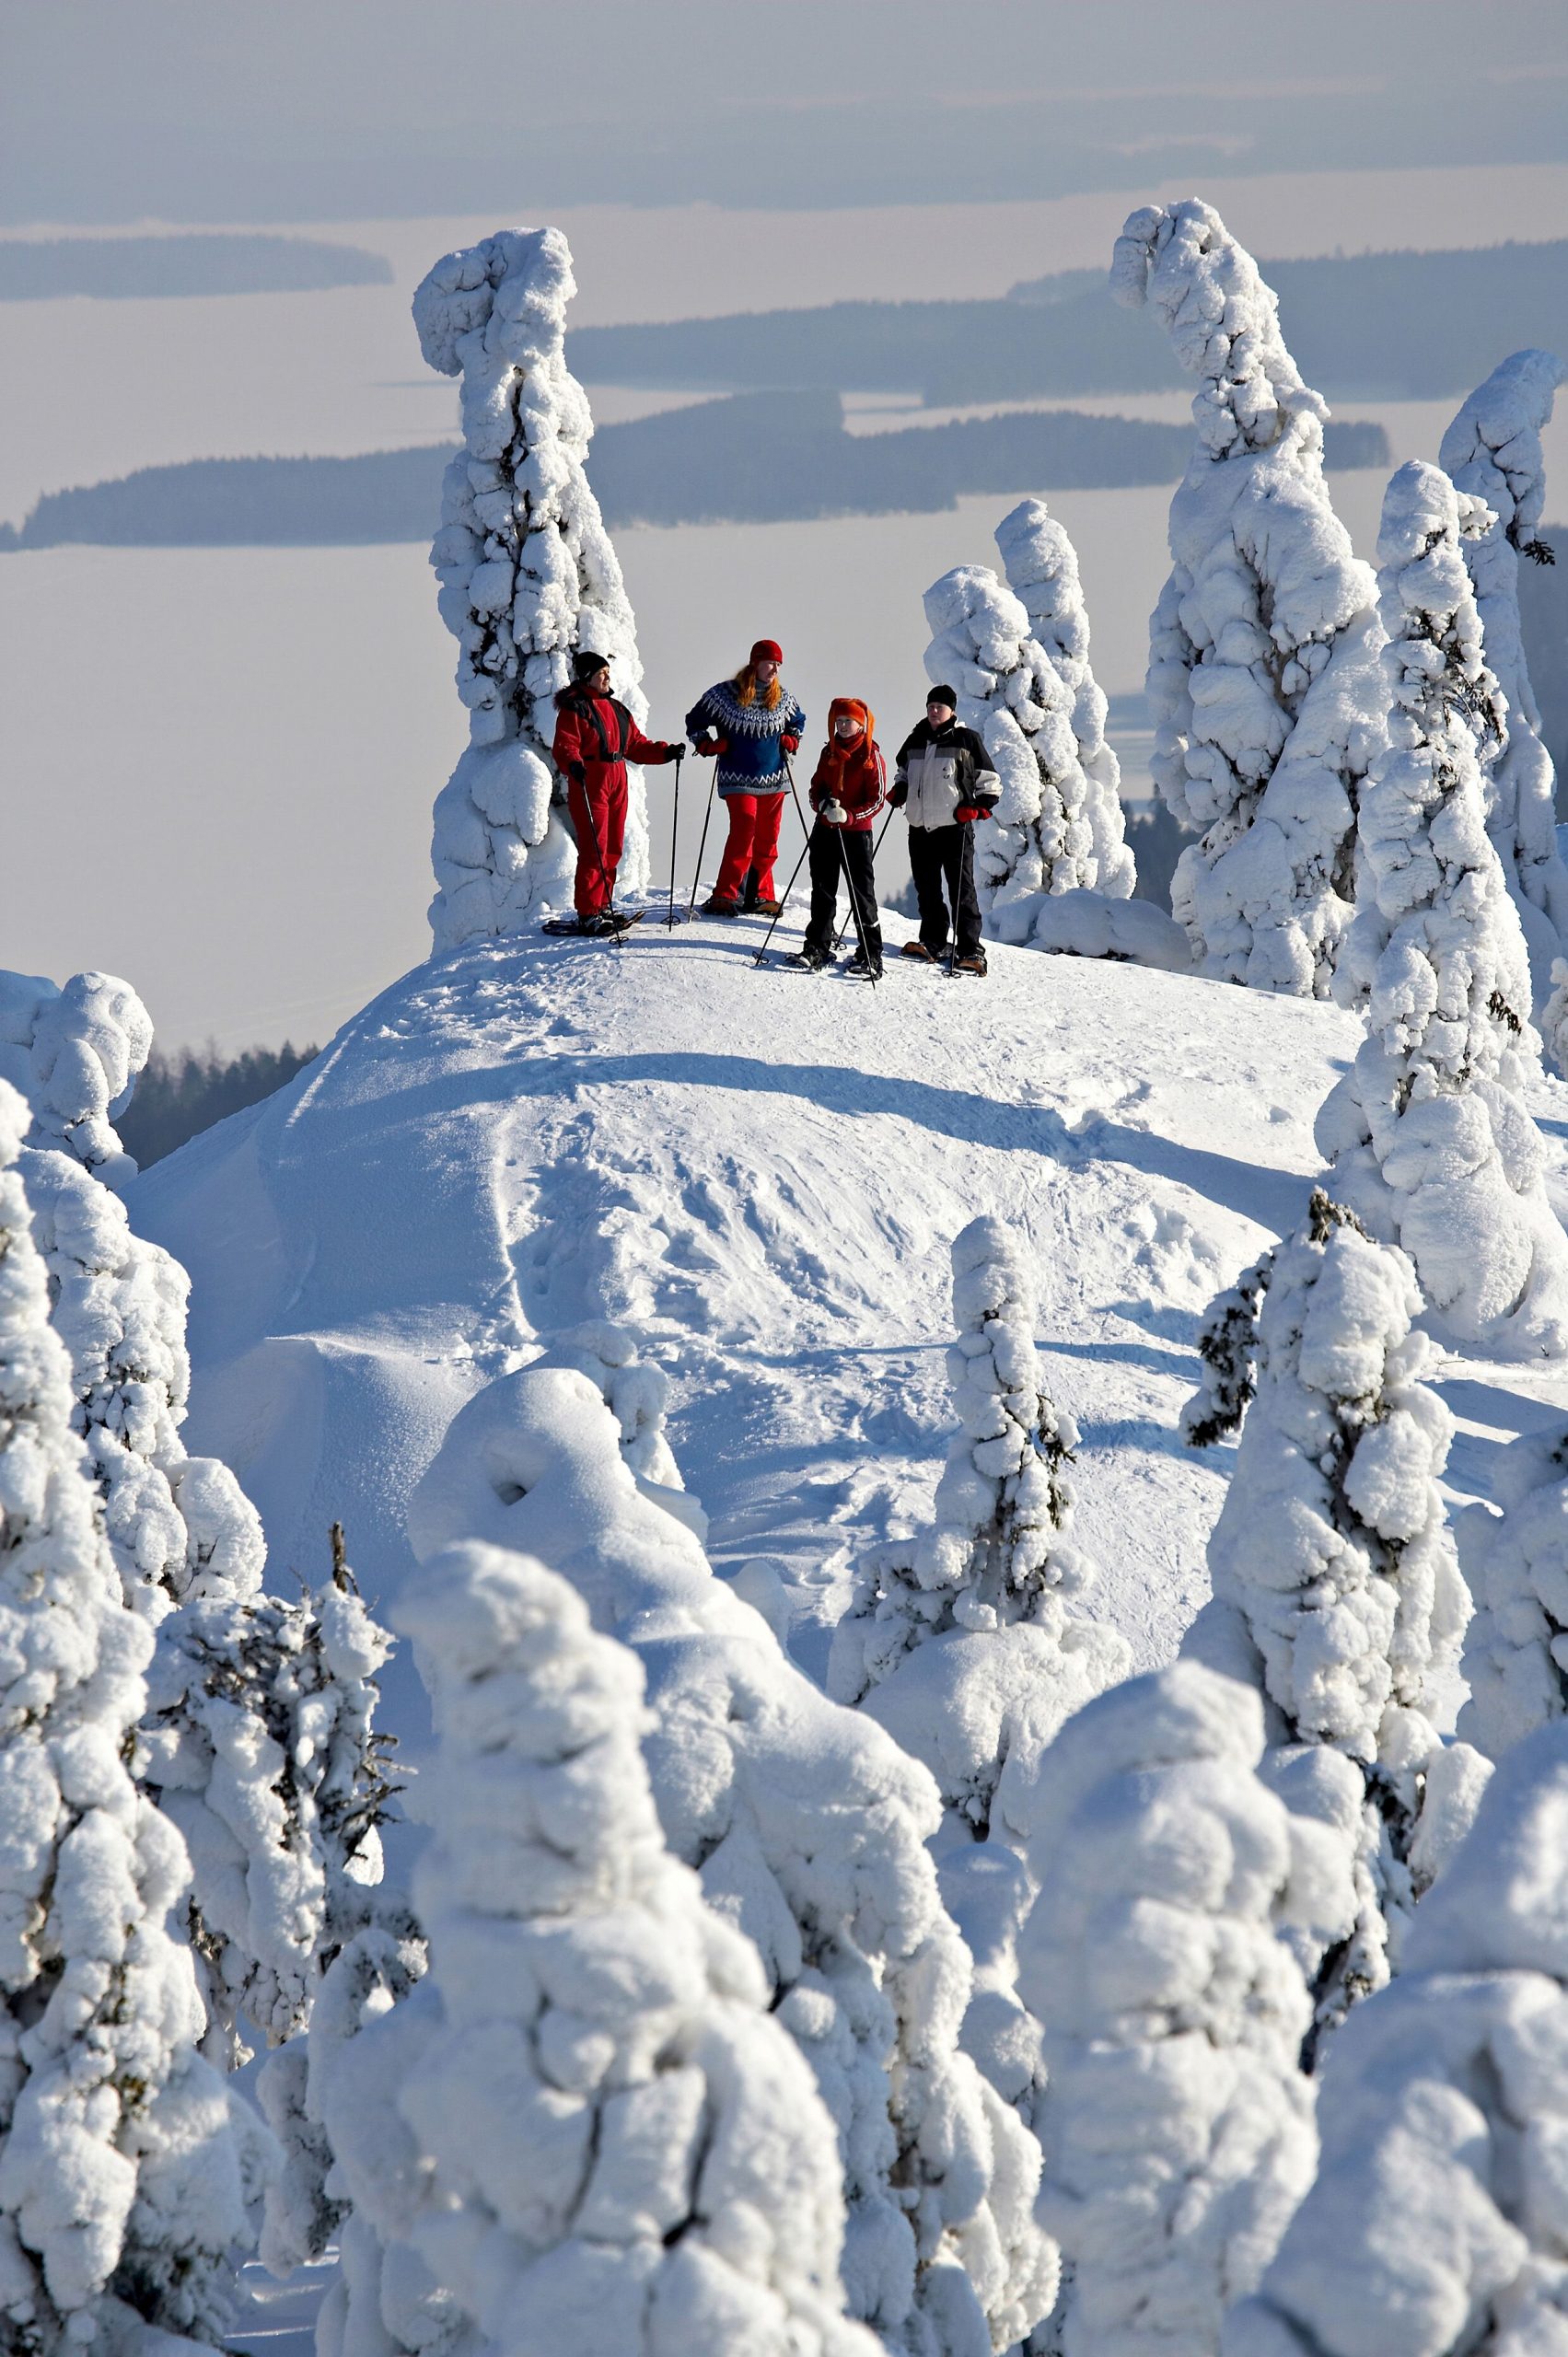
Nature tourism is trending as we start to understand how healthy being in nature is

Nature tourism in Finland is all about “the space to breathe, a time to dream, hiking in summer, cross-country skiing in winter, gathering berries and mushrooms or simply a gentle walk in the woods.” (http://www.visitfinland.com/finrelax/). Nature is also one of the central themes in Master’s Degree Programme in Tourism Marketing and Management (MDPTMM, www.uef.fi/tmm). Why is nature so important for tourism that we have raised it so high in the programme?

Nature tourism brings us closer to nature
Nature has great health benefits for people

There is an increasing amount of evidence that being in the nature has huge benefits for our health. The latest is a 300-page review report from European Commission (link). The report examines more than 200 academic studies exploring the topic from various perspectives.

As more and more of us are living in the cities the interest to travel back to the nature increases. We are bored with congestion, air pollution, noise and eternal hurry. We want to have a place for relaxation, a place to get away from it all. Nature provides balance and health for our busy life and creates fantastic possibilities for example for digital detox.

FinRelax

Nature does as good and people are starting to realize that. Destinations that have good infrastructure for nature tourism will come up strong. But nature tourism needs to be developed in a sustainable way. In Finland for example Visit Finland is focusing on FinRelax program to increase the level of nature tourism products across the country and developing them to a direction that focuses on creating wellbeing for tourists (http://www.visitfinland.com/finrelax/). Finland aims to be the best place to relax in the nature, a noteworthy goal. All the elements are in place and it will be interesting to see how it all plays out. We have a front seat for this as the MDPTMM will work closely with Visit Finland and especially with FinRelax program to understand destination marketing and management.

Get a master’s degree in tourism business

Are you looking for an international tourism-focused master’s degree programme in business? Tourism Marketing and Management programme by University of Eastern Finland provides a unique learning experience for students who have finished their bachelor’s degree and are looking for new skills and knowledge in developing tourism industry in a sustainable way. Read more about the programme at www.uef.fi/tmm.